Once you've implemented Google Analytics, the information you see — such as how much time users spend in your app and where they are in the world — will give you insights that let you improve your app experience. While this data gives you an idea of how users are interacting with your app, you will also want to measure the performance of your business more directly. For example, you might want to know how many times your users sign up for your newsletter or how much revenue your app is generating. To get the most out of your Analytics reporting you first need to define your business goals and ensure you've built an appropriate measurement plan.
Metrics & Dimensions
Google Analytics easy-to-use reporting puts hundreds of Metrics and Dimensions at your fingertips — automatically.
| Metrics | Dimensions |
|---|---|
Metrics are the way that Analytics counts data — the numbers behind
the reports. There are over 300 Metrics measured to help you quantify things like:
|
Dimensions help you slice and dice the data so that you can see subsets. Many
reports have pre-selected dimensions listed as rows in a table. With nearly 350
dimensions you can break down your analysis by:
|
In-App Purchases
While Google Play provides reporting about purchases happening in your app, you can gain more insight by seeing how those actions link to other pieces of information. For example, you might want to know which acquisition channel led to the most in-app purchases. Google Analytics allows you to segment your audience to understand who your best customers are and what the levers are that you can use to maximize revenue and turn more people into paying users.
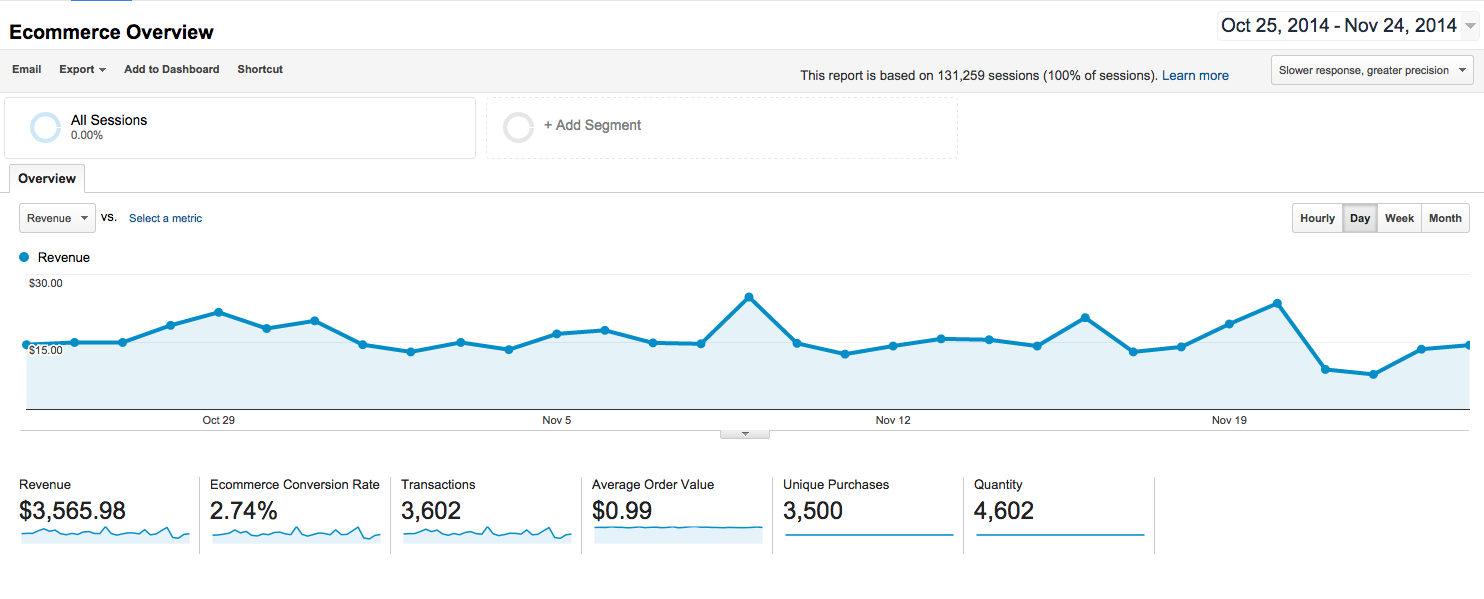
Retail Sales and Ecommerce Transactions
When you're selling real products within your app, if you don’t have robust analytics you won't be able to understand the specific purchase behavior of your users and you may draw the wrong conclusions about why some products are selling more than others. Google Analytics Enhanced Ecommerce offers deep insights into shopper behavior, so that you can make smarter decisions. You can:
- Analyze how far shoppers get in the shopping funnel and where they drop off
- Understand which products are viewed most, which are frequently abandoned in cart, and which ones convert well
- Upload rich product metadata to slice and dice your data
- Create rich user segments to delve deeper into your users’ shopping behavior and the products they interact with
Activity-Based and In-App Conversions
Tracking downloads and purchases is an important first step to understanding your app performance, but those data points may not provide the full picture you expect for your business. You may want to track other important goals like signups for a newsletter or achievements unlocked in your game. With Google Analytics you can focus on what matters the most for your business by setting specific actions in your app as goals. You can even understand how these goals are related to key conversion metrics, tying it back to install sources in order to have a comprehensive view of your marketing efforts.
Custom Data
Activating the Google Analytics library makes many metrics available to you without additional work. Included among these are global metrics and dimensions that apply to many businesses — the number of users, their breakdown by country, length of sessions, and more. However, you'll likely have specific parts of your app or experience that are unique to your business. To capture this type of information, Google Analytics has several ways to send custom data that you define and incorporate into your app. That way, you can really dig in and understand the specifics of how users interact with your app.
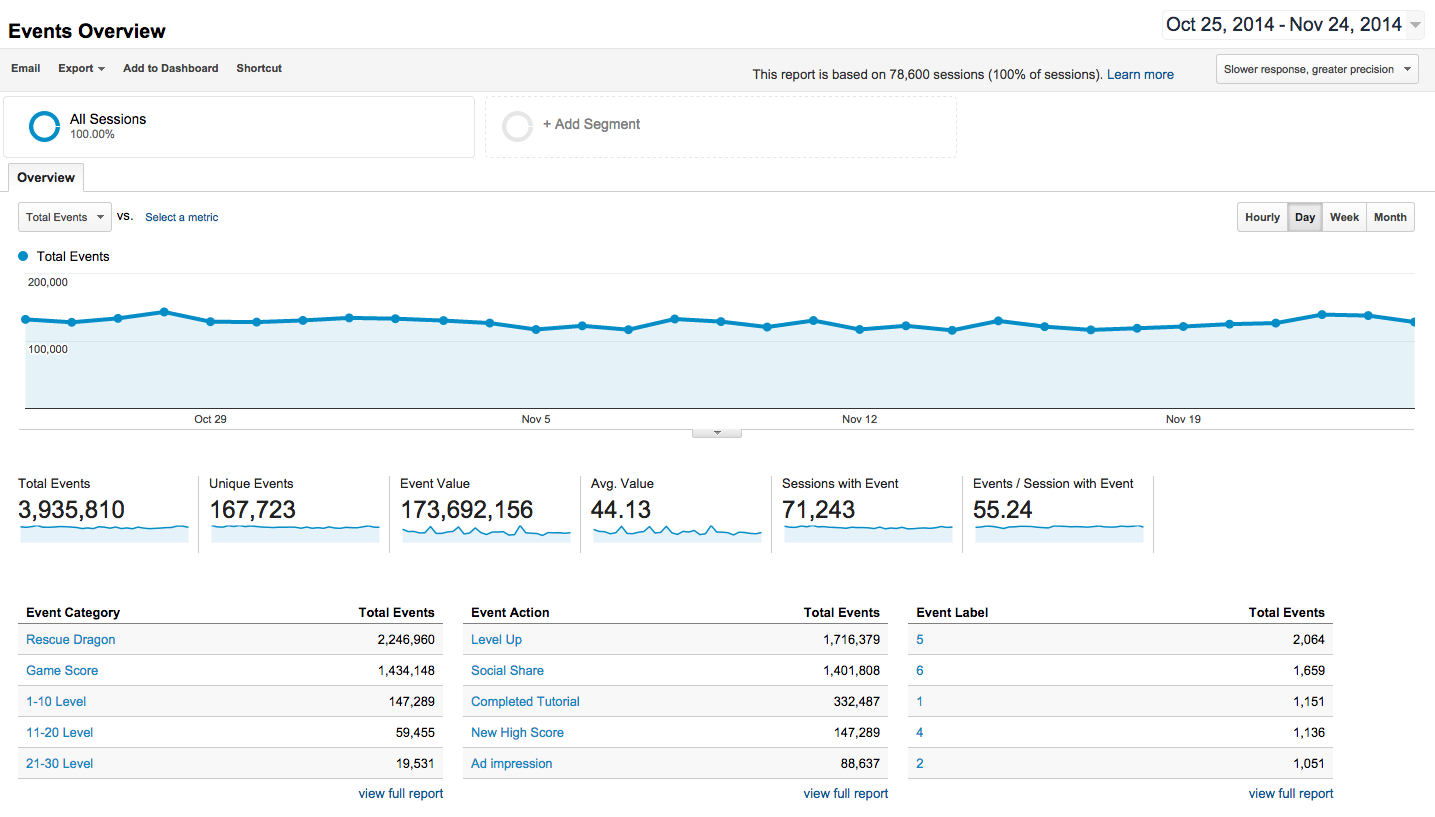
Events
One of the most common and easiest ways to track user behavior is with events. Events are powerful for capturing specific actions that are relevant to your business. They are often used to capture a specific moment in time; an example of an event might be a Level Up. In this example, you'd configure your code to send data to Google Analytics every time a user successfully passed a level. You can send multiple properties with an event so you can group your events based on the analysis you intend to do.
Custom Dimensions
Custom dimensions are another way to send custom data that is specific to your business. Good for capturing a state of something in your app, custom dimensions can be scoped at a user, session, hit, or product level. A common use case might be using a user-scoped custom dimension to capture the furthest level that a player has achieved. Using this, you could do an analysis to understand what the breakdown was of users in different levels. An example of a hit-level custom dimension could be capturing landscape or portrait orientation with every hit, so that you can better understand the breakdown of orientation as users play your game. Custom dimensions can be used very creatively to get at how different types of users engage with your app.
User ID
A specific custom dimension that may be of interest to your business is the User ID override. Instead of using a randomly generated identifier, you may send Google Analytics an identifier for a given user if you use one in your own CRM systems. This enables cross-device reporting as you can track user behavior across platforms. Note that your custom identifier must be an identifier without any personally identifiable information; an account ID (not an email address) is a good example of a common use case here.
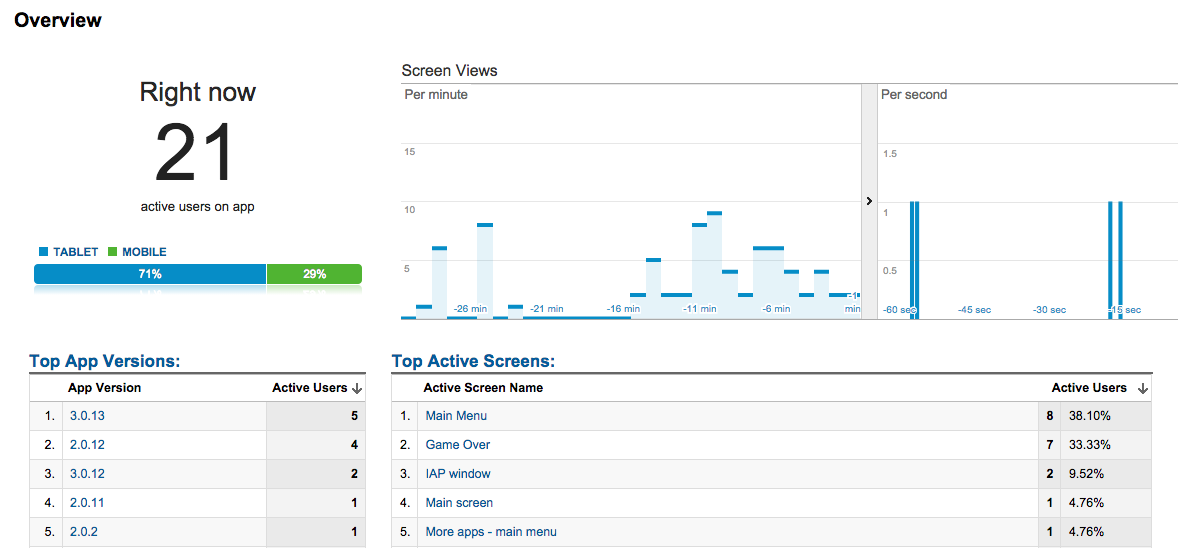
Real-Time Perspective
Google Analytics reporting is available in real-time. This powerful capability helps you understand app usage as it happens. Are users updating to your latest version? Is your new marketing campaign having the effect you expected? Is a scheduled in-app event driving up usage? You can answer all these questions and more while they're actually happening.