In-App Analytics will help you understand user behavior and ultimately user value over time. Fundamentally, users are people — and no two people are exactly alike. You can explore what makes your different groups of users unique and, in turn, how these groups respond to your app content, features, and monetization strategies. The more you understand about what your users respond to, the better you can tailor your apps to meet their needs.
Assign Value to User Goals
Different types of developers value their users differently — and different types of users have different values. Google Analytics gives you the power to value your users in the way that makes the most sense to you.
By using Google Analytics goals, you can define specific actions in your app that mean the most to your business: perhaps it’s important that your users reach a specific screen in your app or that they spend a designated time playing your game. Perhaps you define a goal based on whether or not a user completed a certain event (like completing a level).
Whatever the method used, you can assign a monetary value to a goal in order to put a dollar value on an action. Perhaps it’s worth $3 if a user completes a given level or $.50 if they sign up with an account. By assigning value to given behaviors, you can really dig into the data to understand your most valuable users.
Google Analytics also lets you view Revenue per User for transactions in your app (such as in-app purchases). Pair this data with segments to drill down to find your most valuable users.
Know your users with Audience Reporting and Demographic and Interest reports
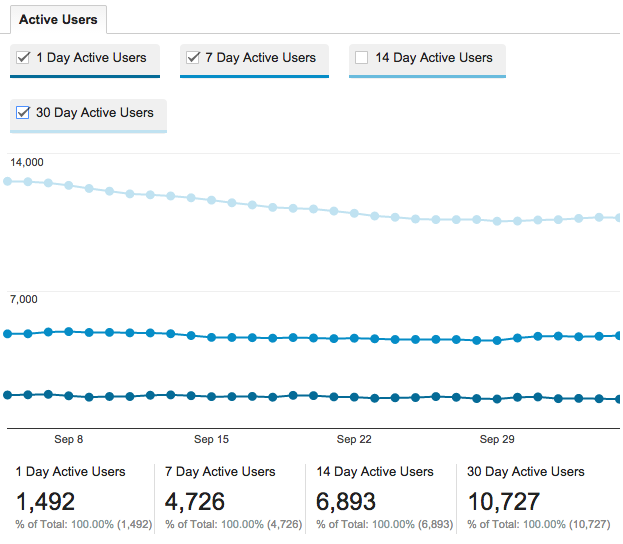
Google Analytics’ Audience Reporting section highlights a wealth of data about your users’ characteristics: what app versions they’re using, what devices they’re on, where they’re from, and what they're interested in. Among these, the Active Users reports highlight how users come back over time.
Google Analytics’ Demographics & Interest reports highlight information about your users gathered using Google Analytics’ extensive reach in apps. See the Gender & Age breakdown to discover the demographic characteristics most common among your users, or take a look at the Interest reports to see what interest categories entice your users.

All Things Change with Time, and So Do Your Users
Getting users to install and open your app the first time is a big accomplishment; however, it’s only the first step of what is hopefully a long and prosperous relationship. The best apps aren’t just the ones with the most downloads, they are the ones that have users coming back day after day, month after month, and year after year.
Google Analytics takes a user-centric approach to reporting to help you explore what keeps users coming back. Cohort Reporting allows you to see which users come back over time and when usage tends to fall off. You can easily take this same information and overlay it on any other report.

Measure Value over Time
Analyzing retention is a great way to ensure users stick with your app and come back day after day. With Lifetime Value reporting, you’ll get a full picture of these users’ value over time. To get the most out of this report, it’s important to start with a clear definition of what a user’s value means to you based on your business objectives.
Once you’ve defined the value, you can access the report to measure certain variables such as revenue per user and number of screen views per user over a period of 90 days. For example, if the goal of your app is to get users to purchase virtual or material goods, you’ll want to use this report to get a clear view of when they make a purchase and how much they are spending in your app over time.
Lifetime Value is a key metric to use to measure the effectiveness of your acquisition campaigns. If your cost to acquire a new user is higher than the average value over time, you might want to optimize your campaigns to meet the lifetime revenue they generate. Lifetime Value is particularly valuable if you offer in-app purchases, but it can be applied to discovering many other useful insights, such as number of times they open your app, total number of screens and goal completions.
Segment Your Data
Looking at aggregated data helps you understand overall user behavior trends, such as how their purchase patterns change over time. However, in order to understand why purchase patterns changed you need to segment your data.
Segmentation allows you to isolate and analyze subsets of your data, based on specific attributes. For example, you might segment your data by marketing channel so that you can see which channel is responsible for an increase in purchases.
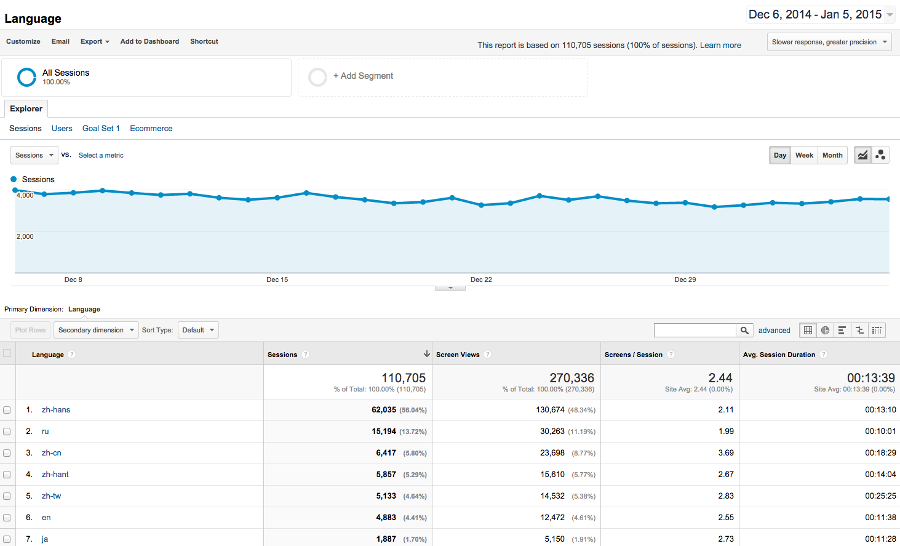
Drilling down to look at segments of your data helps you understand what caused a change to your aggregated data. All reports in Google Analytics provide for segmentation of your traffic. For example, each row in your Language report shows how a specific segment performed. This lets you compare different segments and understand which languages are bringing in the highest value traffic.
Here are some common segments that you might want to consider when looking at your own data:
- Date and time, to compare how users who visit your site on certain days of the week or certain hours of the day behave
- Device or app version, to compare user performance on different operating systems or app updates
- Marketing channel, to compare the difference in performance for various marketing activities
- Geography, to determine which countries, regions or cities perform the best
- Customer characteristics, such as repeat customers vs. first-time customers, to help you understand what drives users to become loyal customers.
To use segments, click Add Segment above the report on any data set you’re interested in breaking up. See the 15 System segments that come with any app profile; these are default segments that allow you to do basic analysis on elements like New Users, Android/iOS Traffic, or Tablet traffic. If you need to dig deeper into your data, you can build a custom segment by clicking +New Segment in the top right. Using any combination of dimensions and metrics, you can create segments specific to your business. The combinations of criteria are so extensive, hundreds of thousands of permutations are available.
For example, for a report across all sessions in a date range you may choose to include only users whose cumulative revenue across all sessions in a date range is greater than $100; or only users who viewed a specific screen, then completed a specific event, but never actually made a transaction.
Alternatively, you could include only sessions that were the result of a specific advertising campaign or only sessions that resulted from a specific campaign AND resulted in a goal completion.
Another way to generate segments is to import from the gallery. When you click Add Segment, click Import from gallery (next to +New Segment). Using the Gallery you can import segments that other businesses have found useful — maybe you're interested in importing segments that pertain to engaged traffic or mobile commerce. Choose from hundreds of segment packs to find the ones that make sense for you.

Segmentation is a powerful way to slice and dice your data in order to unlock insights about users and their behavior. Use this information to improve your app and find more people that resemble your high-value users.
Understand What Makes Your Users Tick with Further Analysis
Using the power of segmentation, you can perform very sophisticated analysis on the types of users using your app — are your buyers concentrated in a particular geographic area? Are users who visit a certain screen getting stuck and abandoning your game? Are there certain behaviors that lead to more conversions? What crashes are having the most impact on your revenue?
Understanding what properties make up an engaged and monetized user base is important for developing a strategy to find similar users and for building users’ experiences based on their behavior.