In this document
User interface (UI) performance testing ensures that your app not only meets its functional requirements, but that user interactions with your app are buttery smooth, running at a consistent 60 frames per second (why 60fps?), without any dropped or delayed frames, or as we like to call it, jank. This document explains tools available to measure UI performance, and lays out an approach to integrate UI performance measurements into your testing practices.
Measuring UI Performance
In order to improve performance you first need the ability to measure the performance of your system, and then diagnose and identify problems that may arrive from various parts of your pipeline.
dumpsys is an Android tool that runs on the device and dumps interesting information about the status of system services. Passing the gfxinfo command to dumpsys provides an output in logcat with performance information relating to frames of animation that are occurring during the recording phase.
> adb shell dumpsys gfxinfo <PACKAGE_NAME>
This command can produce multiple different variants of frame timing data.
Aggregate frame stats
With the M Preview the command prints out aggregated analysis of frame data to logcat, collected across the entire lifetime of the process. For example:
Stats since: 752958278148ns
Total frames rendered: 82189
Janky frames: 35335 (42.99%)
90th percentile: 34ms
95th percentile: 42ms
99th percentile: 69ms
Number Missed Vsync: 4706
Number High input latency: 142
Number Slow UI thread: 17270
Number Slow bitmap uploads: 1542
Number Slow draw: 23342
These high level statistics convey at a high level the rendering performance of the app, as well as its stability across many frames.
Precise frame timing info
With the M Preview comes a new command for gfxinfo, and that’s framestats which provides extremely detailed frame timing information from recent frames, so that you can track down and debug problems more accurately.
>adb shell dumpsys gfxinfo <PACKAGE_NAME> framestats
This command prints out frame timing information, with nanosecond timestamps, from the last 120 frames produced by the app. Below is example raw output from adb dumpsys gfxinfo <PACKAGE_NAME> framestats:
0,27965466202353,27965466202353,27965449758000,27965461202353,27965467153286,27965471442505,27965471925682,27965474025318,27965474588547,27965474860786,27965475078599,27965479796151,27965480589068,
0,27965482993342,27965482993342,27965465835000,27965477993342,27965483807401,27965486875630,27965487288443,27965489520682,27965490184380,27965490568703,27965491408078,27965496119641,27965496619641,
0,27965499784331,27965499784331,27965481404000,27965494784331,27965500785318,27965503736099,27965504201151,27965506776568,27965507298443,27965507515005,27965508405474,27965513495318,27965514061984,
0,27965516575320,27965516575320,27965497155000,27965511575320,27965517697349,27965521276151,27965521734797,27965524350474,27965524884536,27965525160578,27965526020891,27965531371203,27965532114484,
Each line of this output represents a frame produced by the app. Each line has a fixed number of columns describing time spent in each stage of the frame-producing pipeline. The next section describes this format in detail, including what each column represents.
Framestats data format
Since the block of data is output in CSV format, it's very straightforward to paste it to your spreadsheet tool of choice, or collect and parse with a script. The following table explains the format of the output data columns. All timestamps are in nanoseconds.
- FLAGS
- Rows with a ‘0’ for the FLAGS column can have their total frame time computed by subtracting the INTENDED_VSYNC column from the FRAME_COMPLETED column.
- If this is non-zero the row should be ignored, as the frame has been determined as being
an outlier from normal performance, where it is expected that layout & draw take longer
than 16ms. Here are a few reasons this could occur:
- The window layout changed (such as the first frame of the application or after a rotation)
- It is also possible the frame was skipped in which case some of the values will have garbage timestamps. A frame can be skipped if for example it is out-running 60fps or if nothing on-screen ended up being dirty, this is not necessarily a sign of a problem in the app.
- INTENDED_VSYNC
- The intended start point for the frame. If this value is different from VSYNC, there was work occurring on the UI thread that prevented it from responding to the vsync signal in a timely fashion.
- VSYNC
- The time value that was used in all the vsync listeners and drawing for the frame (Choreographer frame callbacks, animations, View.getDrawingTime(), etc…)
- To understand more about VSYNC and how it influences your application, check out the Understanding VSYNC video.
- OLDEST_INPUT_EVENT
- The timestamp of the oldest input event in the input queue, or Long.MAX_VALUE if there were no input events for the frame.
- This value is primarily intended for platform work and has limited usefulness to app developers.
- NEWEST_INPUT_EVENT
- The timestamp of the newest input event in the input queue, or 0 if there were no input events for the frame.
- This value is primarily intended for platform work and has limited usefulness to app developers.
- However it’s possible to get a rough idea of how much latency the app is adding by looking at (FRAME_COMPLETED - NEWEST_INPUT_EVENT).
- HANDLE_INPUT_START
- The timestamp at which input events were dispatched to the application.
- By looking at the time between this and ANIMATION_START it is possible to measure how long the application spent handling input events.
- If this number is high (>2ms), this indicates the app is spending an unusually long time processing input events, such as View.onTouchEvent(), which may indicate this work needs to be optimized, or offloaded to a different thread. Note that there are some scenarios, such as click events that launch new activities or similar, where it is expected and acceptable that this number is large.
- ANIMATION_START
- The timestamp at which animations registered with Choreographer were run.
- By looking at the time between this and PERFORM_TRANVERSALS_START it is possible to determine how long it took to evaluate all the animators (ObjectAnimator, ViewPropertyAnimator, and Transitions being the common ones) that are running.
- If this number is high (>2ms), check to see if your app has written any custom animators or what fields ObjectAnimators are animating and ensure they are appropriate for an animation.
- To learn more about Choreographer, check out the For Butter or Worse video.
- PERFORM_TRAVERSALS_START
- If you subtract out DRAW_START from this value, you can extract how long the layout & measure phases took to complete. (note, during a scroll, or animation, you would hope this should be close to zero..)
- To learn more about the measure & layout phases of the rendering pipeline, check out the Invalidations, Layouts and Performance video
- DRAW_START
- The time at which the draw phase of performTraversals started. This is the start point of recording the display lists of any views that were invalidated.
- The time between this and SYNC_START is how long it took to call View.draw() on all the invalidated views in the tree.
- For more information on the drawing model, see Hardware Acceleration or the Invalidations, Layouts and Performance video
- SYNC_QUEUED
- The time at which a sync request was sent to the RenderThread.
- This marks the point at which a message to start the sync phase was sent to the RenderThread. If the time between this and SYNC_START is substantial (>0.1ms or so), it means that the RenderThread was busy working on a different frame. Internally this is used to differentiate between the frame doing too much work and exceeding the 16ms budget and the frame being stalled due to the previous frame exceeding the 16ms budget.
- SYNC_START
- The time at which the sync phase of the drawing started.
- If the time between this and ISSUE_DRAW_COMMANDS_START is substantial (>0.4ms or so), it typically indicates a lot of new Bitmaps were drawn which must be uploaded to the GPU.
- To understand more about the sync phase, check out the Profile GPU Rendering video
- ISSUE_DRAW_COMMANDS_START
- The time at which the hardware renderer started issuing drawing commands to the GPU.
- The time between this and FRAME_COMPLETED gives a rough idea of how much GPU work the app is producing. Problems like too much overdraw or inefficient rendering effects show up here.
- SWAP_BUFFERS
- The time at which eglSwapBuffers was called, relatively uninteresting outside of platform work.
- FRAME_COMPLETED
- All done! The total time spent working on this frame can be computed by doing FRAME_COMPLETED - INTENDED_VSYNC.
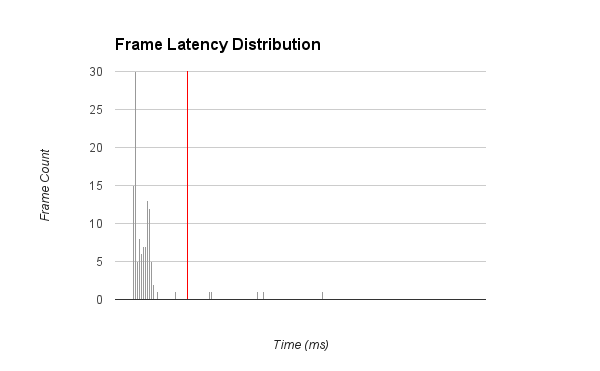
You can use this data in different ways. One simple but useful visualization is a histogram showing the distribution of frames times (FRAME_COMPLETED - INTENDED_VSYNC) in different latency buckets, see figure below. This graph tells us at a glance that most frames were very good - well below the 16ms deadline (depicted in red), but a few frames were significantly over the deadline. We can look at changes in this histogram over time to see wholesale shifts or new outliers being created. You can also graph input latency, time spent in layout, or other similar interesting metrics based on the many timestamps in the data.
Simple frame timing dump
If Profile GPU rendering is set to In adb shell dumpsys gfxinfo
in Developer Options, the adb shell dumpsys gfxinfo command prints out timing
information for the most recent 120 frames, broken into a few different categories with
tab-separated-values. This data can be useful for indicating which parts of the drawing pipeline
may be slow at a high level.
Similar to framestats above, it's very straightforward to paste it to your spreadsheet tool of choice, or collect and parse with a script. The following graph shows a breakdown of where many frames produced by the app were spending their time.
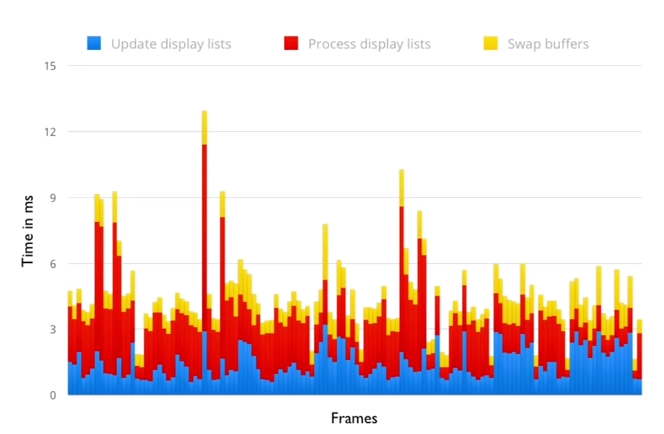
The result of running gfxinfo, copying the output, pasting it into a spreadsheet application, and graphing the data as stacked bars.
Each vertical bar represents one frame of animation; its height represents the number of milliseconds it took to compute that frame of animation. Each colored segment of the bar represents a different stage of the rendering pipeline, so that you can see what parts of your application may be creating a bottleneck. For more information on understanding the rendering pipeline, and how to optimize for it, see the Invalidations Layouts and Performance video.
Controlling the window of stat collection
Both the framestats and simple frame timings gather data over a very short window - about two seconds worth of rendering. In order to precisely control this window of time - for example, to constrain the data to a particular animation - you can reset all counters, and aggregate statistics gathered.
>adb shell dumpsys gfxinfo <PACKAGE_NAME> reset
This can also be used in conjunction with the dumping commands themselves to collect and reset at a regular cadence, capturing less-than-two-second windows of frames continuously.
Diagnosing performance regressions
Identification of regressions is a good first step to tracking down problems, and maintaining high application health. However, dumpsys just identifies the existence and relative severity of problems. You still need to diagnose the particular cause of the performance problems, and find appropriate ways to fix them. For that, it’s highly recommended to use the systrace tool.
Additional resources
For more information on how Android’s rendering pipeline works, common problems that you can find there, and how to fix them, some of the following resources may be useful to you:
- Rendering Performance 101
- Why 60fps?
- Android UI and the GPU
- Invalidations Layouts and performance
- Analyzing UI Performance with Systrace
Automating UI Perfomance Tests
One approach to UI Performance testing is to simply have a human tester perform a set of user operations on the target app, and either visually look for jank, or spend an very large amount of time using a tool-driven approach to find it. But this manual approach is fraught with peril - human ability to perceive frame rate changes varies tremendously, and this is also time consuming, tedious, and error prone.
A more efficient approach is to log and analyze key performance metrics from automated UI tests. The Android M developer preview includes new logging capabilities which make it easy to determine the amount and severity of jank in your application’s animations, and that can be used to build a rigorous process to determine your current performance and track future performance objectives.
This article walks you through a recommended approach to using that data to automate your performance testing.
This is mostly broken down into two key actions. Firstly, identifying what you're testing, and how you’re testing it. and Secondly, setting up, and maintaining an automated testing environment.
Setting up UI tests
Before you can get started with automated testing, it’s important to determine a few high level decisions, in order to properly understand your test space, and needs you may have.
Identify key animations / flows to test
Remember that bad performance is most visible to users when it interrupts a smooth animation. As such, when identifying what types of UI actions to test for, it’s useful to focus on the key animations that users see most, or are most important to their experience. For example, here are some common scenarios that may be useful to identify:
- Scrolling a primary ListView or RecyclerView
- Animations during async wait cycles
- Any animation that may have bitmap loading / manipulation in it
- Animations including Alpha Blending
- Custom View drawing with Canvas
Work with engineers, designers, and product managers on your team to prioritize these key product animations for test coverage.
Define your future objectives and track against them
From a high-level, it may be critical to identify your specific performance goals, and focus on writing tests, and collecting data around them. For example:
- Do you just want to begin tracking UI performance for the first time to learn more?
- Do you want to prevent regressions that might be introduced in the future?
- Are you at 90% of smooth frames today and want to get to 98% this quarter?
- Are you at 98% smooth frames and don’t want to regress?
- Is your goal to improve performance on low end devices?
In all of these cases, you’ll want historical tracking which shows performance across multiple versions of your application.
Identify devices to test on
Application performance varies depending on the device it's running on. Some devices may contain less memory, less powerful GPUs, or slower CPU chips. This means that animations which may perform well on one set of hardware, may not on others, and worse, may be a result of a bottleneck in a different part of the pipeline. So, to account for this variation in what a user might see, pick a range of devices to execute tests on, both current high end devices, low end devices, tablets, etc. Look for variation in CPU performance, RAM, screen density, size, and so on. Tests that pass on a high end device may fail on a low end device.
Basic frameworks for UI Testing
Tool suites, like UI Automator and Espresso, are built to help automate the action of a user moving through your application. These are simple frameworks which mimic user interaction with your device. To use these frameworks, you effectively create unique scripts, which run through a set of user-actions, and play them out on the device itself.
By combining these automated tests, alongside dumpsys gfxinfo you can quickly
create a reproducible system that allows you to execute a test, and measure the
performance information of that particular condition.
Setting up automated UI testing
Once you have the ability to execute a UI test, and a pipeline to gather the data from a single test, the next important step is to embrace a framework which can execute that test multiple times, across multiple devices, and aggregate the resulting performance data for further analysis by your development team.
A framework for test automation
It’s worth noting that UI testing frameworks (like UI Automator) run on the target device/emulator directly. While performance gathering information done by dumpsys gfxinfo is driven by a host machine, sending commands over ADB. To help bridge the automation of these separate entities, MonkeyRunner framework was developed; A scripting system that runs on your host machine, which can issue commands to a set of connected devices, as well as receive data from them.
Building a set of scripts for proper automation of UI Performance testing, at a minimum, should be able to utilize monkeyRunner to accomplish the following tasks:
- Load & Launch a desired APK to a target device, devices, or emulator.
- Launch a UI Automator UI test, and allow it to be executed
- Collect performance information through dumpsys gfxinfo.
- Aggregate information and display it back in a useful fashion to the developer.
Triaging and fixing observed problems
Once problem patterns or regressions are identified, the next step is identifying and applying the fix. If your automated test framework preserves precise timing breakdowns for frames, it can help you scrutinize recent suspicious code/layout changes (in the case of regression), or narrow down the part of the system you’re analyzing when you switch to manual investigation. For manual investigation, systrace is a great place to start, showing precise timing information about every stage of the rendering pipeline, every thread and core in the system, as well as any custom event markers you define.
Properly profiling temporal timings
It is important to note the difficulties in obtaining and measuring timings that come from rendering performance. These numbers are, by nature, non deterministic, and often fluctuate depending on the state of the system, amount of memory available, thermal throttling, and the last time a sun flare hit your area of the earth. The point is that you can run the same test, twice and get slightly different numbers that may be close to each other, but not exact.
Properly gathering and profiling data in this manner means running the same test, multiple times, and accumulating the results as an average, or median value. (for the sake of simplicity, let’s call this a ‘batch’) This gives you the rough approximation of the performance of the test, while not needing exact timings.
Batches can be used between code changes to see the relative impact of those changes on performance. If the average frame rate for the pre-change Batch is larger than the post-change batch, then you generally have an overall win wrt performance for that particular change.
This means that any Automated UI testing you do should take this concept into consideration, and also account for any anomalies that might occur during a test. For example, if your application performance suddenly dips, due to some device issue (that isn’t caused by your application) then you may want to re-run the batch in order to get less chaotic timings.
So, how many times should you run a test, before the measurements become meaningful? 10 times should be the minimum, with higher numbers like 50 or 100 yielding more accurate results (of course, you’re now trading off time for accuracy)