Android Studio enables you to debug apps running on the emulator or on an Android device. With Android Studio, you can:
- Select a device to debug your app on.
- View the system log.
- Set breakpoints in your code.
- Examine variables and evaluate expressions at run time.
- Run the debugging tools from the Android SDK.
- Capture screenshots and videos of your app.
To debug your app, Android Studio builds a debuggable version of your app, connects to a device or to the emulator, installs the app and runs it. The IDE shows the system log while your app is running and provides debugging tools to filter log messages, work with breakpoints, and control the execution flow.
Run your App in Debug Mode
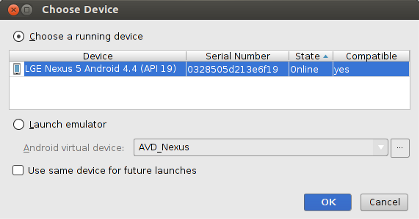
Figure 1. The Choose Device window enables you to select a physical Android device or a virtual device to debug your app.
To run your app in debug mode, you build an APK signed with a debug key and install it on a physical Android device or on the Android emulator. To set up an Android device for development, see Using Hardware Devices. For more information about the emulator provided by the Android SDK, see Using the Emulator.
To debug your app in Android Studio:
- Open your project in Android Studio.
- Click Debug
 in the toolbar.
 - On the Choose Device window, select a hardware device from the list or choose a virtual device.
- Click OK. Your app starts on the selected device.
Figure 1 shows the Choose Device window. The list shows all the Android devices
connected to your computer. Select Launch Emulator to use an Android virtual device
instead. Click the ellipsis  to open the
Android Virtual Device Manager.
to open the
Android Virtual Device Manager.
Android Studio opens the Debug tool window when you debug your app. To open the
Debug window manually, click Debug
 .
This window shows threads and variables in the Debugger tab, the device status in the
Console tab, and the system log in the Logcat tab. The Debug tool
window also provides other debugging tools covered in the following sections.
.
This window shows threads and variables in the Debugger tab, the device status in the
Console tab, and the system log in the Logcat tab. The Debug tool
window also provides other debugging tools covered in the following sections.
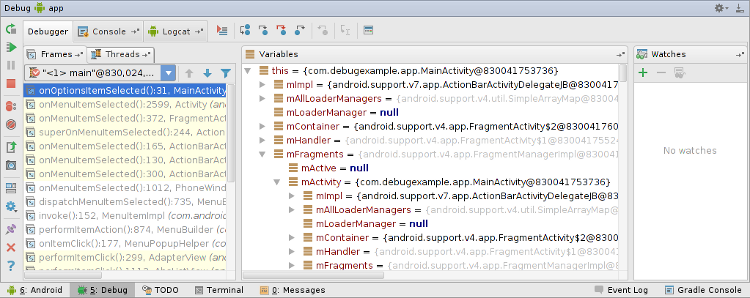
Figure 2. The Debug tool window in Android Studio showing the current thread and the object tree for a variable.
Attach the debugger to a running process
You don't always have to restart your app to debug it. To debug an app that you're already running:
- Click Attach debugger to Android proccess
 .
. - In the Choose Process window, select the device and app you want to attach the debugger to.
- To open the Debug tool window, click Debug
.
Use the System Log
The system log shows system messages while you debug your app. These messages include information from apps running on the device. If you want to use the system log to debug your app, make sure your code writes log messages and prints the stack trace for exceptions while your app is in the development phase.
Write log messages in your code
To write log messages in your code, use the Log class. Log messages
help you understand the execution flow by collecting the system debug output while you interact
with your app. Log messages can tell you what part of your application failed. For more
information about logging, see
Reading and Writing Logs.
The following example shows how you might add log messages to determine if previous state information is available when your activity starts:
import android.util.Log;
...
public class MyActivity extends Activity {
    private static final String TAG = MyActivity.class.getSimpleName();
    ...
    @Override
    public void onCreate(Bundle savedInstanceState) {
        if (savedInstanceState != null) {
            Log.d(TAG, "onCreate() Restoring previous state");
            /* restore state */
        } else {
            Log.d(TAG, "onCreate() No saved state available");
            /* initialize app */
        }
    }
}
During development, your code can also catch exceptions and write the stack trace to the system log:
void someOtherMethod() {
    try {
        ...
    } catch (SomeException e) {
        Log.d(TAG, "someOtherMethod()", e);
    }
}
Note: Remove debug log messages and stack trace print calls from
your code when you are ready to publish your app. You could do this by setting a DEBUG
flag and placing debug log messages inside conditional statements.
View the system log
Both the Android DDMS (Dalvik Debug Monitor Server) and the Debug tool windows show the system log; however, the Android DDMS tool window lets you view only log messages for a particular process. To view the system log on the Android DDMS tool window:
- Start your app as described in Run your App in Debug Mode.
- Click Android
 to open the Android DDMS
tool window.
to open the Android DDMS
tool window. - If the system log is empty in the Logcat view, click Restart
 .
.
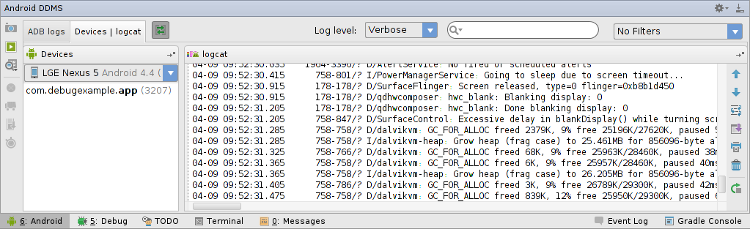
Figure 4. The system log in the Android DDMS tool window.
The Android DDMS tool window gives you access to some DDMS features from Android Studio. For more information about DDMS, see Using DDMS.
The system log shows messages from Android services and other Android apps. To filter the log messages to view only the ones you are interested in, use the tools in the Android DDMS window:
- To show only log messages for a particular process, select the process in the
Devices view and then click Only Show Logcat from Selected
Process
 . If the Devices view
is not available, click Restore Devices View
. If the Devices view
is not available, click Restore Devices View
 on the right of the Android
DDMS tool window. This button is only visible when you hide the Devices
window.
on the right of the Android
DDMS tool window. This button is only visible when you hide the Devices
window. - To filter log messages by log level, select a level under Log Level on the top of the Android DDMS window.
- To show only log messages that contain a particular string, enter the string in the search box and press Enter.
Work with Breakpoints
Breakpoints enable you to pause the execution of your app at a particular line of code, examine variables, evaluate expressions, and continue the execution line by line. Use breakpoints to determine the causes of run-time errors that you can't fix by looking at your code only. To debug your app using breakpoints:
- Open the source file in which you want to set a breakpoint.
- Locate the line where you want to set a breakpoint and click on it.
- Click on the yellow portion of the side bar to the left of this line, as shown in figure 5.
- Start your app as described in Run your App in Debug Mode.
Android Studio pauses the execution of your app when it reaches the breakpoint. You can then use the tools in the Debug tool window to identify the cause of the error.
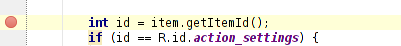
Figure 5. A red dot appears next to the line when you set a breakpoint.
View and configure breakpoints
To view all the breakpoints and configure breakpoint settings, click View
Breakpoints  on the left side of the Debug tool
window. The Breakpoints window appears, as shown in figure 6.
on the left side of the Debug tool
window. The Breakpoints window appears, as shown in figure 6.
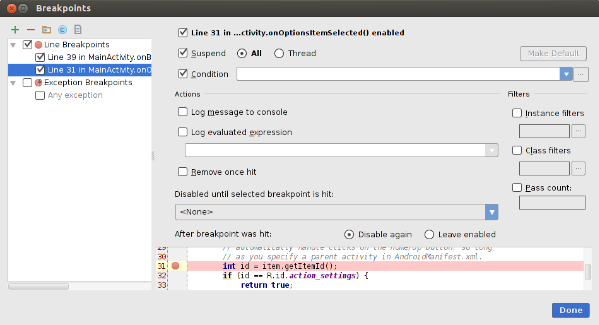
Figure 6. The Breakpoints window lists all the current breakpoints and includes behavior settings for each.
The Breakpoints window lets you enable or disable each breakpoint from the list on the left. If a breakpoint is disabled, Android Studio does not pause your app when it hits that breakpoint. Select a breakpoint from the list to configure its settings. You can configure a breakpoint to be disabled at first and have the system enable it after a different breakpoint is hit. You can also configure whether a breakpoint should be disabled after it is hit. To set a breakpoint for any exception, select Exception Breakpoints in the list of breakpoints.
Debug your app with breakpoints
After you set breakpoints in your code, click Rerun
to start the app again. When a breakpoint is
hit, Android Studio pauses the app and highlights the breakpoint in the source code. The
Debug tool window lets you examine variables and control the execution step by
step:
-
To examine the object tree for a variable, expand it in the Variables view. If the Variables view is not visible, click Restore Variables View
 .
. -
To evaluate an expression at the current execution point, click Evaluate Expression
 .
. -
To advance to the next line in the code (without entering a method), click Step Over
 .
. -
To advance to the first line inside a method call, click Step Into
 .
. -
To advance to the next line outside the current method, click Step Out
 .
. -
To continue running the app normally, click Resume Program
 .
.
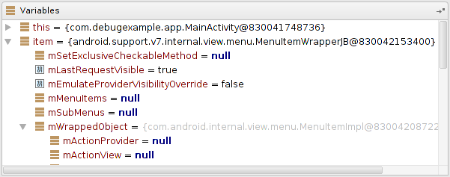
Figure 7. The Variables view in the Debug tool window.
Track Object Allocation
Android Studio lets you track objects that are being allocated on the Java heap and see which classes and threads are allocating these objects. This allows you to see the list of objects allocated during a period of interest. This information is valuable for assessing memory usage that can affect application performance.
To track memory allocation of objects:
- Start your app as described in Run Your App in Debug Mode.
- Click Android to open the Android DDMS
tool window.
- On the Android DDMS tool window, select the Devices | logcat tab.
- Select your device from the dropdown list.
- Select your app by its package name from the list of running apps.
- Click Start Allocation Tracking

- Interact with your app on the device.
- Click Stop Allocation Tracking

Android Studio shows the objects that the system allocated with the following information:
- Allocation order
- Allocated class
- Allocation size
- Thread ID
- Allocation method, class, and line number
- Stack trace at the point of allocation
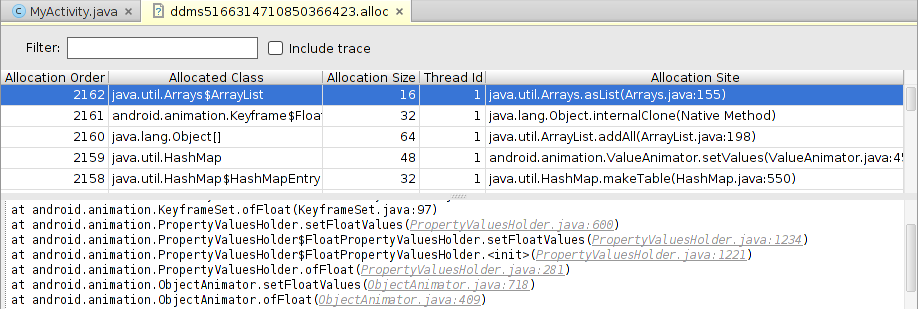
Figure 8. Object allocation tracking in Android Studio.
Analyze Runtime Metrics to Optimize your App
Even if your application does not generate runtime errors, this does not mean it is free of problems. You should also consider the following issues:
- Does your app use memory efficiently?
- Does your app generate unnecessary network traffic?
- What methods should you focus your attention on to improve the performance of your app?
- Does your app behave properly when the user receives a phone call or a message?
The Android Device Monitor is a stand-alone tool with a graphical user interface for serveral Android application debugging and analysis tools, including the Dalvik Debug Monitor Server (DDMS). You can use the Android Device Monitor to analyze memory usage, profile methods, monitor network traffic and simulate incoming calls and messages.
To open the Android Device Monitor from Android Studio, click
Monitor  on the toolbar. The Android Device Monitor
opens in a new window.
on the toolbar. The Android Device Monitor
opens in a new window.
For more information about the Android Device Monitor and DDMS, see Device Monitor and Using DDMS.
Capture Screenshots and Videos
Android Studio enables you to capture a screenshot or a short video of the device screen while your app is running. Screenshots and videos are useful as promotional materials for your app, and you can also attach them to bug reports that you send to your development team.
To take a screenshot of your app:
- Start your app as described in Run your App in Debug Mode.
- Click Android to open the Android DDMS
tool window.
- Click Screen Capture
 on the left side of the
Android DDMS tool window.
on the left side of the
Android DDMS tool window. - Optional: To add a device frame around your screenshot, enable the Frame screenshot option.
- Click Save.
To take a video recording of your app:
- Start your app as described in Run your App in Debug Mode.
- Click Android to open the Android DDMS
tool window.
- Click Screen Record
 on the left side of the
Android DDMS tool window.
on the left side of the
Android DDMS tool window. - Click Start Recording.
- Interact with your app.
- Click Stop Recording.
- Enter a file name for the recording and click OK.