Show navigation Hide navigation

Heap Viewer Walkthrough

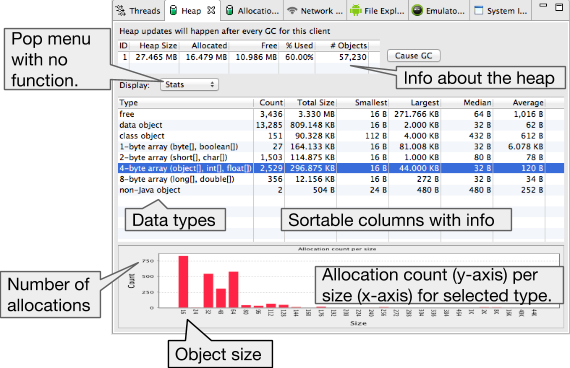
This walkthrough shows the basic usage and workflow for the Heap Viewer tool. Heap Viewer reports in real-time what types of objects your application has allocated, how many, and their sizes on the heap.

What it's good for:

  • Getting a sense of how your app allocates and frees memory.
  • Identifying memory leaks.

Prerequisites

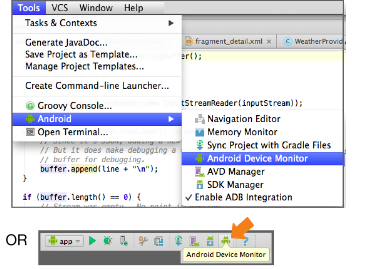
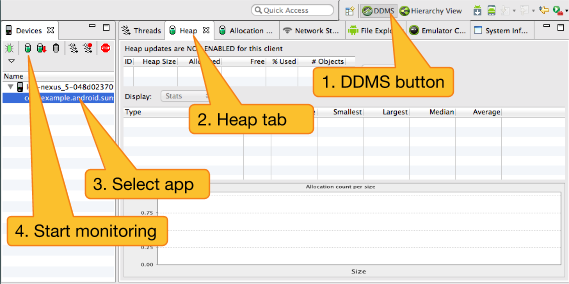
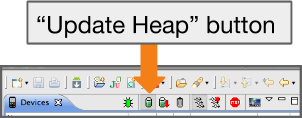
Working with Heap Viewer

    1. Figure 1. Starting Android Device Monitor.

    2. Connect your mobile device to your computer.
    3. Open your application in Android Studio, build the source, and run it on your device.
    4. Start the Android Device Monitor from Android Studio: Tools -> Android -> Android Device Monitor.

    1. Figure 2. Steps for Using Heap Viewer.

    2. Make sure your device and application are showing in the Devices tab.
    3. Click the DDMS button, because the Heap Viewer is one of the DDMS tools.
    4. Click the Heap tab, which is where your data will appear.
    5. In the Devices tab, select the app you want to monitor.

    1. Figure 3. Update Heap button.

    2. To start monitoring, click the Update Heap button, which looks like a green can.

    1. Figure 4. Triggering GC (Garbage Collection).

    2. Note the Heap updates will happen after every GC for this client. message.
    3. Press the Cause CG button to trigger a garbage collection event.

    1. Figure 5. Example Heap Viewer output.

    2. Click a data type to see detailed information on its current allocations on the heap.
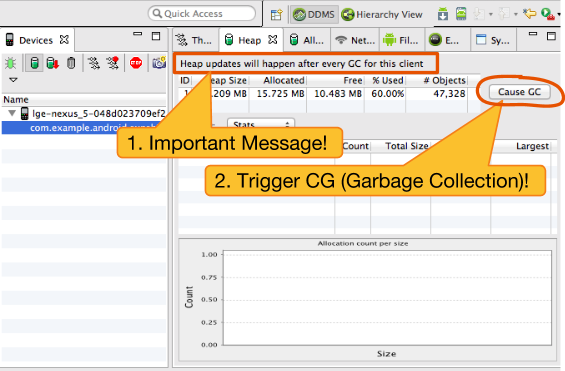
  • Note: To visualize allocation changes over time, combine several snapshots of the bar graph into an animated gif or video.