While developing your application, you should check that user interactions are buttery smooth, running at a consistent 60 frames per second. If something goes wrong, and a frame gets dropped, the first step in fixing the problem is understanding what the system is doing.
The Systrace tool allows you to collect and inspect timing information across an entire Android device, which is called a trace. It shows where time and CPU cycles are being spent, displaying what each thread and process is doing at any given time. It also inpects the captured tracing information to highlight problems that it observes, from list item recycling to rendering content, and provide recommendations about how to fix them. This document explains how to navigate the trace files produced by the tool, and use them to analyze the performance of an application's user interface (UI).
Overview
Systrace helps you analyze how the execution of your application fits into the many running systems on an Android device. It puts together system and application thread execution on a common timeline. In order to analyze your app with Systrace, you first collect a trace log of your app, and the system activity. The generated trace allows you to view highly detailed, interactive reports showing everything happening the system for the traced duration.
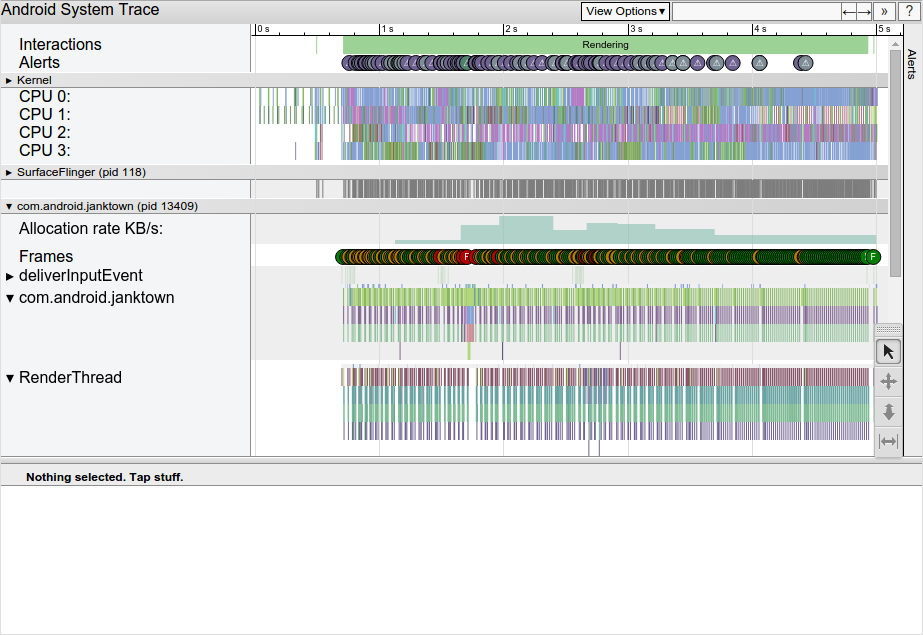
Figure 1. An example Systrace, showing 5 seconds of scrolling an app when it is not performing well.
Figure 1. shows a trace captured while scrolling an app that is not rendering smoothly. By default, a zoomed out view of the traced duration is shown. The horizontal axis is time, and trace events are grouped by process, and then by thread on the vertical axis.
The groupings are in the order Kernel, SurfaceFlinger (the android compositor process), followed by apps, each labeled by package name. Each app process contains all of the tracing signals from each thread it contains, including a hierarchy of high level tracing events based on the enabled tracing categories.
Generating a Trace
In order to create a trace of your application, you must perform a few setup steps. First, you must have a device running Android 4.1 (API 16) or higher. Set up the device for debugging, connect it to your development system, and install your application. Some types of trace information, specifically disk activity and kernel work queues, require that you have root access to the device. However, most Systrace log data only requires that the device be enabled for developer debugging.
Systrace traces can be run either from a command line or from a graphical user interface. This guide focuses on using the command line options.
Tracing on Android 4.3 and higher
To run a trace on Android 4.3 and higher devices:
- Make sure the device is connected through a USB cable and is enabled for debugging.
- Run the trace with the options you want, for example:
$ cd android-sdk/platform-tools/systrace
$ python systrace.py --time=10 -o mynewtrace.html sched gfx view wm
- On the device, execute any user actions you want be included in the trace.
For more information on the available options for running Systrace, see the Systrace help page.
Tracing on Android 4.2 and lower
To use Systrace effectively with devices running Android 4.2 and lower, you must configure the types of processes you want to trace before running a trace. The tool can gather the following types of process information:
- General system processes such as graphics, audio and input processes (selected using trace category tags).
- Low level system information such as CPU, kernel and disk activity (selected using options).
To set trace tags for Systrace using the command-line:
- Use the
--set-tagsoption:$ cd android-sdk/platform-tools/systrace $ python systrace.py --set-tags=gfx,view,wm
- Stop and restart the
adbshell to enable tracing of these processes.$ adb shell stop $ adb shell start
To set trace tags for Systrace using the device user interface:
- On the device connected for tracing, navigate to: Settings > Developer options > Monitoring > Enable traces.
- Select the categories of processes to be traced and click OK.
Note: The adb shell does not have to be stopped and restarted when
selecting trace tags using this method.
After you have configured the category tags for your trace, you can start collecting information for analysis.
To run a trace using the current trace tag settings:
- Make sure the device is connected through a USB cable and is enabled for debugging.
- Run the trace with the low-level system trace options and limits you want, for example:
$ python systrace.py --cpu-freq --cpu-load --time=10 -o mytracefile.html
- On the device, execute any user actions you want be included in the trace.
For more information on the available options for running Systrace, see the Systrace help page.
Analyzing a Trace
After you have generated a trace, open the output html file using a web browser. This section explains how to analyze and interpret the information that the tool produces to find and fix UI performance problems.
Inspecting Frames
Each app that is rendering frames shows a row of frame circles, which are typically colored green. Circles that are colored yellow or red, exceeding the 16.6 millisecond run time limit required to maintain a stable 60 frames per second. Zoom in using the 'w' key to see the frames of your application, and look for long-running frames getting in the way of smoothness.
Note: Hit the '?' key, or the button in the top right for help navigating the trace.
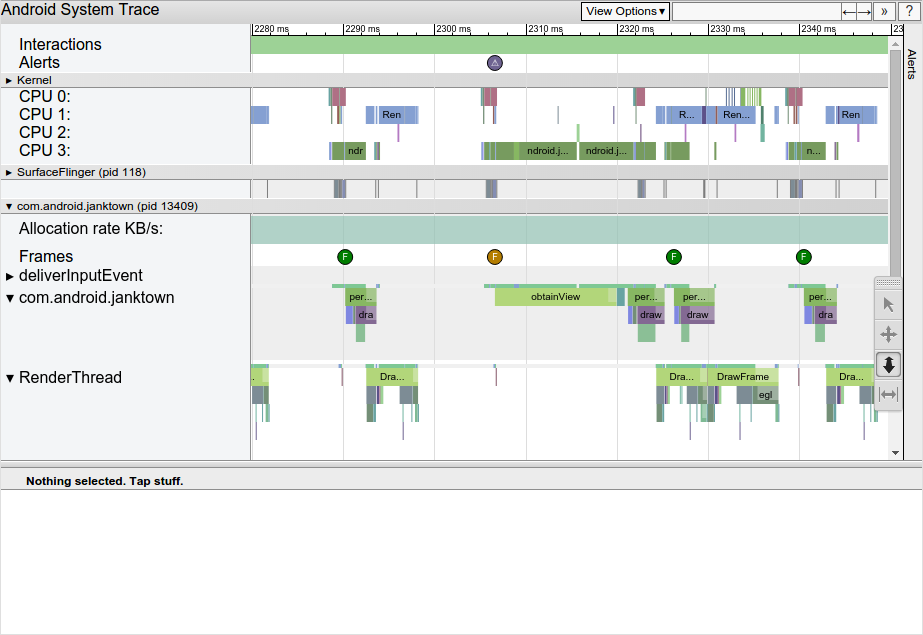
Figure 2. Systrace display after zooming in on a long-running frame.
Clicking on one such frame highlights it, focusing only on the work done by the system for that frame. On devices running Android 5.0 (API level 21) or higher, this work is split between the UI Thread and RenderThread. On prior versions, all work in creating a frame is done on the UI Thread.
Click on individual components of the frame to see how long they took to run. Some events, such as performTraversals, describe what the system is doing in that method when you select it. Selecting a frame displays any alerts present in that frame.
Investigating Alerts
Systrace does automatic analysis of the events in the trace, and highlights many performance problems as alerts, suggesting what to do next.
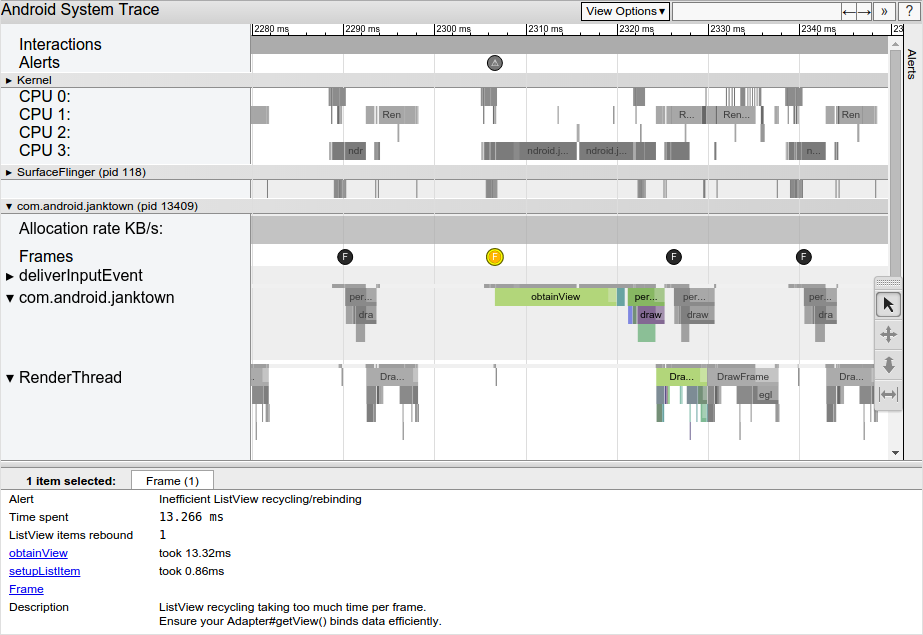
Figure 3. Selecting the problematic frame, an alert is shown identifying a problem.
After you select a slow frame such as the one shown in Figure 3, an alert may be displayed. In
the case above, it calls out that the primary problem with the frame is too much work being done
inside ListView recycling and rebinding. There are links to the relevant
events in the trace, which can be followed to explain more about what the system is doing during
this time.
If you see too much work being done on the UI thread, as in this case with this
ListView work, you can
use Traceview, the app code profiling
tool, to investigate exactly what is taking so much time.
Note that you can also find about every alert in the trace by clicking the Alerts tab to the far right of the window. Doing so expands the Alerts panel, where you can see every alert that the tool discovered in your trace, along with an occurrence count.
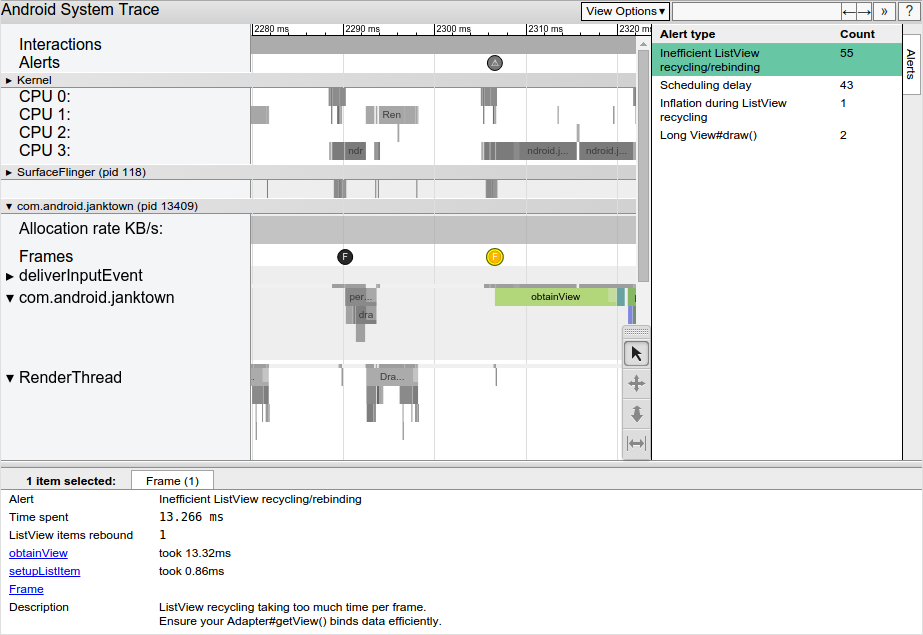
Figure 4. Clicking the Alert button to the right reveals the alert tab.
The Alerts panel helps you see which problems occur in the trace, and how often they contribute to jank. Think of the alerts panel as a list of bugs to be fixed, often a tiny change or improvement in one area can eliminate an entire class of alerts from your application!
Tracing Application Code
The tracing signals defined by the framework do not have visibility into everything your
application is doing, so you may want to add your own. In Android 4.3 (API level 18) and higher, you
can use the methods of the Trace class to add signals to your code. This
technique can help you see what work your application's threads are doing at any given time. Tracing
begin and end events do add overhead while a trace is being captured, a few microseconds each, but
sprinkling in a few per frame, or per worker thread task can go a long way to adding context to a
trace of your app.
The following code example shows how to use the Trace class to track
execution of an application method, including two nested code blocks within that method.
public void ProcessPeople() {
    Trace.beginSection("ProcessPeople");
    try {
        Trace.beginSection("Processing Jane");
        try {
            // code for Jane task...
        } finally {
            Trace.endSection(); // ends "Processing Jane"
        }

        Trace.beginSection("Processing John");
        try {
            // code for John task...
        } finally {
            Trace.endSection(); // ends "Processing John"
        }
    } finally {
        Trace.endSection(); // ends "ProcessPeople"
    }
}
Note: When you nest trace calls within each other, the
endSection() method ends the most recently called
beginSection(String) method. This means that a trace started within another
trace cannot extend beyond the end of the enclosing trace, so make sure your beginning and
ending method calls are properly matched to measure your applications processing.
Note: Traces must begin and end on the same thread. Do not call
beginSection(String) on one thread of execution and then attempt to end the
trace with a call to endSection() on another thread.
When using application-level tracing with Systrace, you must specify the package name of your
application in the user interface or specify the -a or --app= options on the
command line. For more information, see the
Systrace usage guide.
You should enable app level tracing when profiling your app, even if you have not added signals
yourself. Library code can include very useful tracing signals when you enable application-level
tracing. The RecyclerView class is a great example of this,
providing information about several important stages of work it executes.