In this document
You should also read
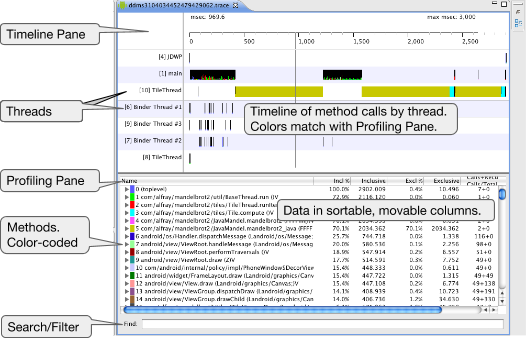
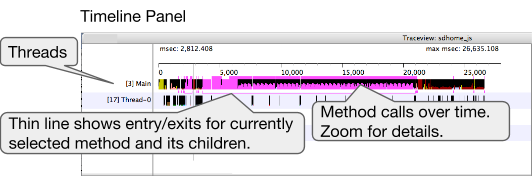
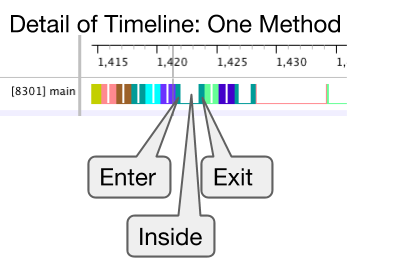
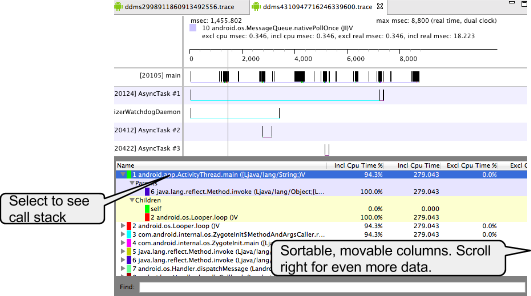
This walkthrough shows the basic usage and workflow for the Traceview tool. Traceview logs method execution over time and shows execution data, per-thread timelines, and call stacks.
What it's good for:
- Tracking down performance problems in your source code.
Prerequisites
- A mobile device with Developer Options enabled.
- Application code. Use your own code, or the Sunshine sample app from the Android Fundamentals Udacity course.
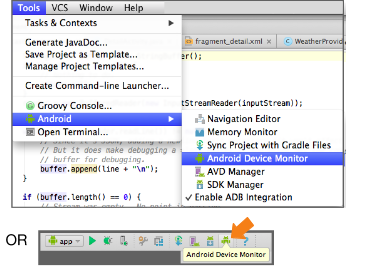
 button.
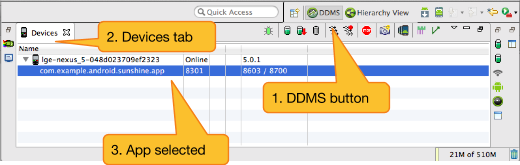
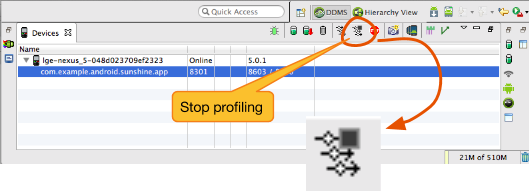
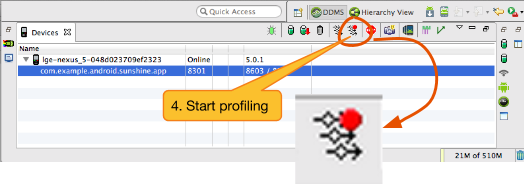
 button.
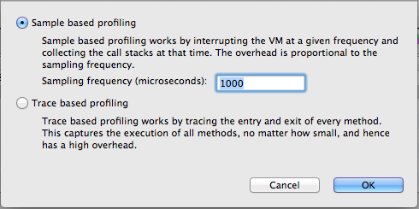