In this document
You should also read
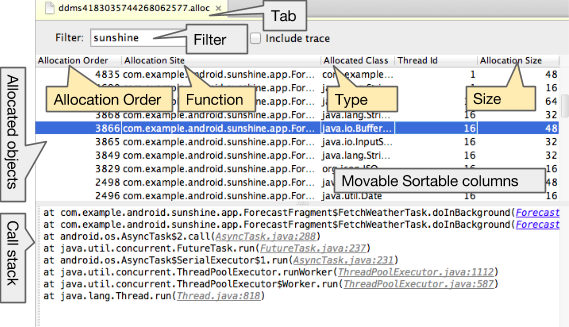
This walkthrough shows the basic usage and workflow for the Allocation Tracker tool in Android Studio. Allocation Tracker records an app's memory allocations and lists all allocated objects for the profiling cycle with their call stack, size, and allocating code.
What it's good for:
- Identifying where many similar object types, from roughly the same call stack, are allocated and deallocated over a very short period of time.
- Finding the places in your code that may contribute to inefficient memory use.
Before using Allocation Tracker, profile your code with the Memory Monitor Tool. If you see many garbage collection events in a short amount of time, use Heap Viewer to identify candidate object types, and Allocation Tracker to determine where this is happening in your code.
Prerequisites
- A mobile device with Developer Options enabled.
- Application code. Use your own code, or the Sunshine sample app from the Android Fundamentals Udacity course.
Working with Allocation Tracker
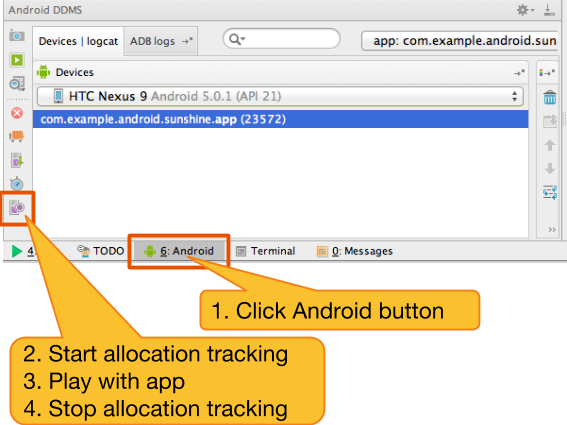
Allocation Tracker records each memory allocation that your app performs during the profiling cycle. You tell Allocation Tracker to start recording and it logs allocations until you tell it to stop.
 (Start Allocation Tracking tooltip).