In this document
You should also read
The Battery Historian chart graphs power-relevant events over time.
Each row shows a colored bar segment when a system component is active and thus drawing current from the battery. The chart does not show how much battery was used by the component, only that the app was active. Charts are organized by category.
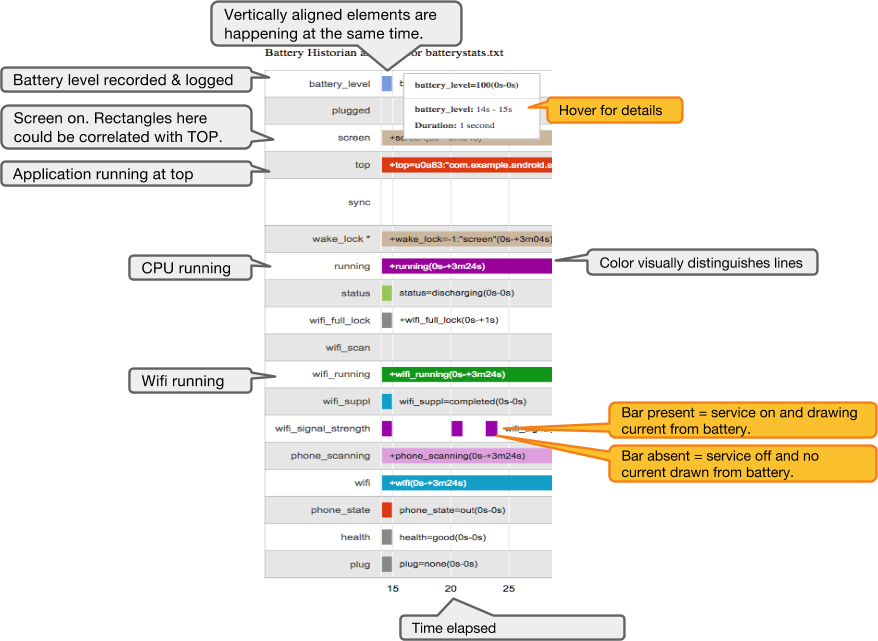
Figure 1. Example of Battery Historian output.
Battery usage categories
- battery_level: When the battery level was recorded and logged. Reported in percent, where 093 is 93%. Provides an overall measure of how fast the battery is draining.
- top: The application running at the top; usually, the application that is visible to the user. If you want to measure battery drain while your app is active, make sure it's the top app. If you want to measure battery drain while your app is in the background, make sure it's not the top app.
- wifi_running: Shows that the Wi-Fi network connection was active.
- screen: Screen is turned on.
- phone_in_call: Recorded when the phone is in a call.
- wake_lock: App wakes up, grabs a lock, does small work, then goes back to sleep. This is one of the most important pieces of information. Waking up the phone is expensive, so if you see lots of short bars here, that might be a problem.
- running: Shows when the CPU is awake. Check whether it is awake and asleep when you expect it to be.
- wake_reason: The last thing that caused the kernel to wake up. If it's your app, determine whether it was necessary.
- mobile_radio: Shows when the radio was on. Starting the radio is battery expensive. Many narrow bars close to each other can indicate opportunities for batching and other optimizations.
- gps: Indicates when the GPS was on. Make sure this is what you expect.
- sync: Shows when an app was syncing with a backend. The sync bar also shows which app did the syncing. For users, this can show apps where they might turn syncing off to save battery. Developers should sync as little as possible and only as often as necessary.
Note: Not every chart will show every category.
Filtering batterystats output
You can gather additional information from the batterystats.txt file
where you saved the output from the batterystats command.
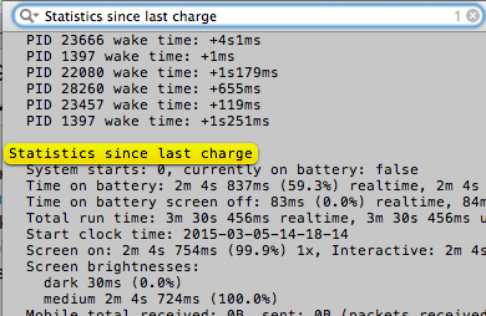
Figure 2.Example of filtered batterystats output.
Open the file in a text editor and search for:
Battery History: A time series of power-relevant events, such as screen, Wi-Fi, and app launch. These are also visible through Battery Historian.Per-PID Stats: How long each process ran.Statistics since last charge: System-wide statistics, such as cell signal levels and screen brightness. Provides an overall picture of what's happening with the device. This information is especially useful to make sure no external events are affecting your experiment.Estimated power use (mAh)by UID and peripheral: This is currently an extremely rough estimate and should not be considered experiment data.Per-app mobile ms per packet: Radio-awake-time divided by packets sent. An efficient app will transfer all its traffic in batches, so the lower this number the better.All partial wake locks: All app-held wakelocks, by aggregate duration and count.