In this document
You should also read
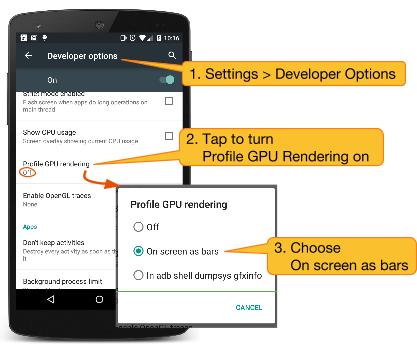
This walkthrough shows how to use Profile GPU Rendering on your mobile device.
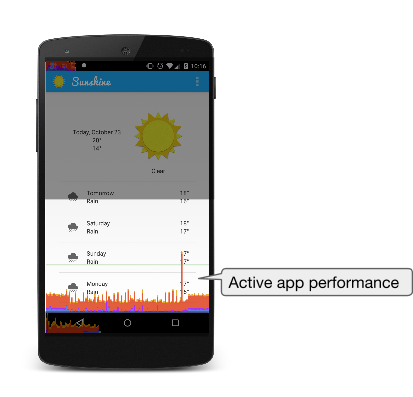
Profile GPU Rendering gives you a quick visual representation of how much time it takes to render the frames of a UI window relative to the 16-ms-per-frame benchmark.
What it's good for:
- Quickly seeing how a UI window performs against the 16-ms-per-frame target.
- Identifying whether any part of the rendering pipeline stands out in using processing time.
- Looking for spikes in frame rendering time associated with user or program actions.
Prerequisites
- A mobile device running at least Android 4.1 with Developer Options enabled.
Working with Profile GPU Rendering
-
The Profile GPU Rendering Graph
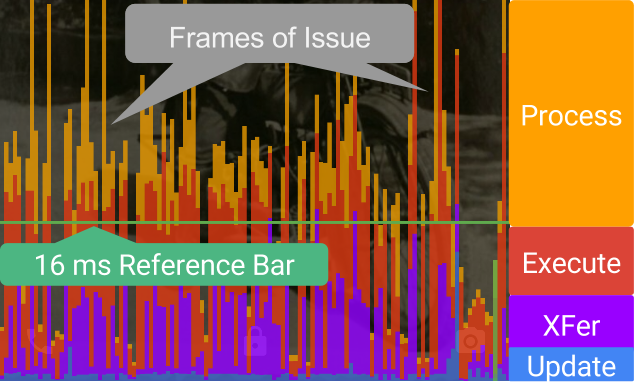
Figure 3. Enlarged Annotated Profile GPU Rendering graph.
In this enlarged image of the Profile GPU Rending graph you can see the colored sections of the graph, and what phase of the rendering pipeline each color represents.
- The green line represents 16 milliseconds. To achieve 60 frames per second, the vertical bar for each frame needs to stay below this 16 ms mark. Any time a bar pushes above this line, there may be pauses in the animations.
- Each bar has a blue, purple (only for Android version 4.0 and higher), red, and orange component.
- The blue section of the bar represents the time used to create and update the View's display lists. If this part of the bar is tall, there may be a lot of custom view drawing, or a lot of work in onDraw methods.
- Android 4.0 and higher: The purple section of the bar represents the time spent transferring resources to the render thread.
- The red section of the bar represents the time spent by Android's 2D renderer issuing commands to OpenGL to draw and redraw display lists. The height of this bar is directly proportional to the sum of the time it takes each display list to execute—more display lists equals a taller red bar.
- The orange section of the bar represents the time the CPU is waiting for the GPU to finish its work. If this bar gets tall, it means the app is doing too much work on the GPU.
Note: While this tool is named Profile GPU Rendering, all monitored processes actually occur in the CPU. Rendering happens by submitting commands to the GPU, and the GPU renders the screen asynchronously. In certain situations, the GPU can have too much work to do, and your CPU will have to wait before it can submit new commands. When this happens, you'll see spikes in the Process (orange bar) and Execute (red bar) stages, and the sommand submission will block until more room is made on the GPU command queue.