In this document
See also
Android Studio is the official IDE for Android application development, based on IntelliJ IDEA. On top of the capabilities you expect from IntelliJ, Android Studio offers:
- Flexible Gradle-based build system
- Build variants and multiple
apkfile generation - Code templates to help you build common app features
- Rich layout editor with support for drag and drop theme editing
linttools to catch performance, usability, version compatibility, and other problems- ProGuard and app-signing capabilities
- Built-in support for Google Cloud Platform, making it easy to integrate Google Cloud Messaging and App Engine
- And much more
If you're new to Android Studio or the IntelliJ IDEA interface, this page provides an introduction to some key Android Studio features.
For specific Android Studio how-to documentation, see the pages in the Workflow section, such as Managing Projects from Android Studio and Building and Running from Android Studio. For a summary of the latest changes to Android Studio, see the Android Studio Release Notes.
Project and File Structure
Android project view
By default, Android Studio displays your project files in the Android project view. This view shows a flattened version of your project's structure that provides quick access to the key source files of Android projects and helps you work with the Gradle-based build system. The Android project view:
- Shows the most important source directories at the top level of the module hierarchy.
- Groups the build files for all modules in a common folder.
- Groups all the manifest files for each module in a common folder.
- Shows resource files from all Gradle source sets.
- Groups resource files for different locales, orientations, and screen types in a single group per resource type.
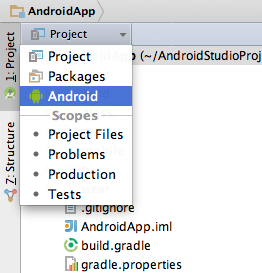
Figure 1. Show the Android project view.
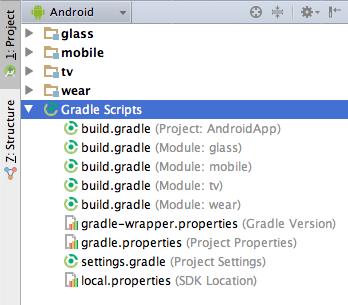
Figure 2. Show project build files.
The Android project view shows all the build files at the top level of the project hierarchy under Gradle Scripts. Each project module appears as a folder at the top level of the project hierarchy and contains these four elements at the top level:
java/- Source files for the module.manifests/- Manifest files for the module.res/- Resource files for the module.Gradle Scripts/- Gradle build and property files.
For example, Android project view groups all the instances of the
ic_launcher.png resource for different screen densities under the same element.
Note: The project structure on disk differs from this flattened representation. To switch to back to the segregated project view, select Project from the Project drop-down.
Other Android Studio views
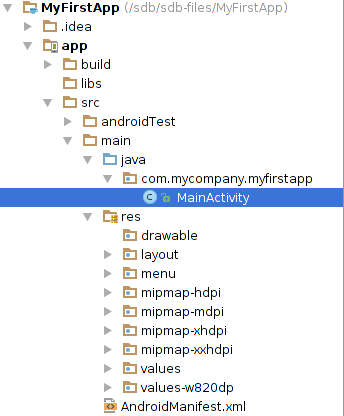
When you use the Project view in Android Studio, you
should notice that the project structure appears different than you may be used to in Eclipse. Each
instance of Android Studio contains a project with one or more application modules. Each
application module folder contains the complete source sets for that module, including
src/main/ and src/androidTest/ directories, resources, build
file and the Android manifest. For the most part, you will need to modify the files under each
module's src/main/ directory for source code updates, the gradle.build file for build
specification and the files under src/androidTest/ directory for test case creation.
You can also customize the view of the project files to focus on specific aspects of your app development:
- Packages
- Project Files
- Scratches
- Problems
- Production
- Tests
For example, selecting the Problems view of your project displays links to the source files containing any recognized coding and syntax errors, such as missing an XML element closing tag in a layout file.
For more information, see IntelliJ project organization and Managing Projects.
Android Build System
The Android build system is the toolkit you use to build, test, run and package your apps. This build system replaces the Ant system used with Eclipse ADT. It can run as an integrated tool from the Android Studio menu and independently from the command line. You can use the features of the build system to:
- Customize, configure, and extend the build process.
- Create multiple APKs for your app with different features using the same project and modules.
- Reuse code and resources across source sets.
The flexibility of the Android build system enables you to achieve all of this without modifying your app's core source files. To build an Android Studio project, see Building and Running from Android Studio. To configure custom build settings in an Android Studio project, see Configuring Gradle Builds.
Debug and Performance
Android Studio provides a number of improvements to assist you in debugging and improving the performance of your code, including an improved virtual device management, inline debugging, and performance analysis tools.
Android Virtual Device (AVD) Manager
AVD Manager has updated screens with links to help you select the most popular device configurations, screen sizes and resolutions for your app previews.
Click the Android Virtual Device Manager in the toolbar to open it and create
new virtual devices for running your app in the emulator.
in the toolbar to open it and create
new virtual devices for running your app in the emulator.
The AVD Manager comes with emulators for Nexus 6 and Nexus 9 devices and also supports creating custom Android device skins based on specific emulator properties and assigning those skins to hardware profiles. Android Studio installs the Intel® x86 Hardware Accelerated Execution Manager (HAXM) emulator accelerator and creates a default emulator for quick app prototyping.
For more information, see Managing AVDs.
Inline debugging
Use inline debugging to enhance your code walk-throughs in the debugger view with inline verification of references, expressions, and variable values. Inline debug information includes:
- Inline variable values
- Referring objects that reference a selected object
- Method return values
- Lambda and operator expressions
- Tool tip values
To enable inline debugging, in the Debug window click the Settings icon
![]() and select the
check box for Show Values In Editor.
and select the
check box for Show Values In Editor.
Memory and CPU monitor
Android Studio provides a memory and CPU monitor view so you can more easily monitor your app's performance and memory usage to track CPU usage, find deallocated objects, locate memory leaks, and track the amount of memory the connected device is using. With your app running on a device or emulator, click the Android tab in the lower left corner of the runtime window to launch the Android runtime window. Click the Memory or CPU tab.
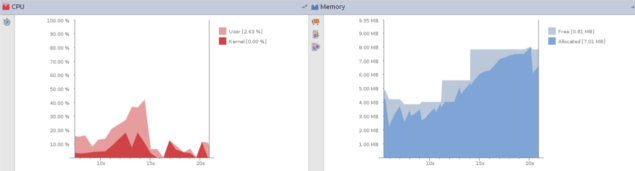
Figure 4. Monitor memory and CPU usage.
Data file access
The Android SDK tools, such as Systrace, logcat, and Traceview, generate performance and debugging data for detailed app analysis.
To view the available generated data files, click Captures in the left
corner of the runtime window. In the list of the generated files, double-click a file to view
the data. Right-click any .hprof files to convert them to a standard
.hprof file format.
Code inspections
In Android Studio, the configured lint
and other IDE inspections run automatically whenever you compile your program. In addition to the
configured lint checks, additional
IntelliJ code inspections and annotation validation run to streamline code
review.
Android Studio enables several lint checks
to ensure:
Cipher.getInstance()is used with safe values- In custom Views, the associated declare-styleable for the custom view uses the same base name as the class name
- Security check for fragment injection
- Where ever property assignment no longer works as expected
- Gradle plugin version is compatible with the SDK
- Right to left validation
- Required API version
- many others
Hovering over an inspection error displays the full issue explanation inline for easy error resolution. There is also a helpful hyperlink at the end of the error message for additional error information.
With Android Studio, you can also run lint inspections for a specific build variant, or
for all build variants. You can configure the lint inspections that run by adding a
lintOptions property to the Android settings in the build.gradle
file.
android {
    lintOptions {
       // set to true to turn off analysis progress reporting by lint
       quiet true
       // if true, stop the gradle build if errors are found
       abortOnError false
       // if true, only report errors
       ignoreWarnings true
    }
You can also manage inspection profiles and configure inspections within Android Studio. Choose File > Settings >, expand the Editor options, and select Inspections. The Inspection Configuration page appears with the supported inspections.
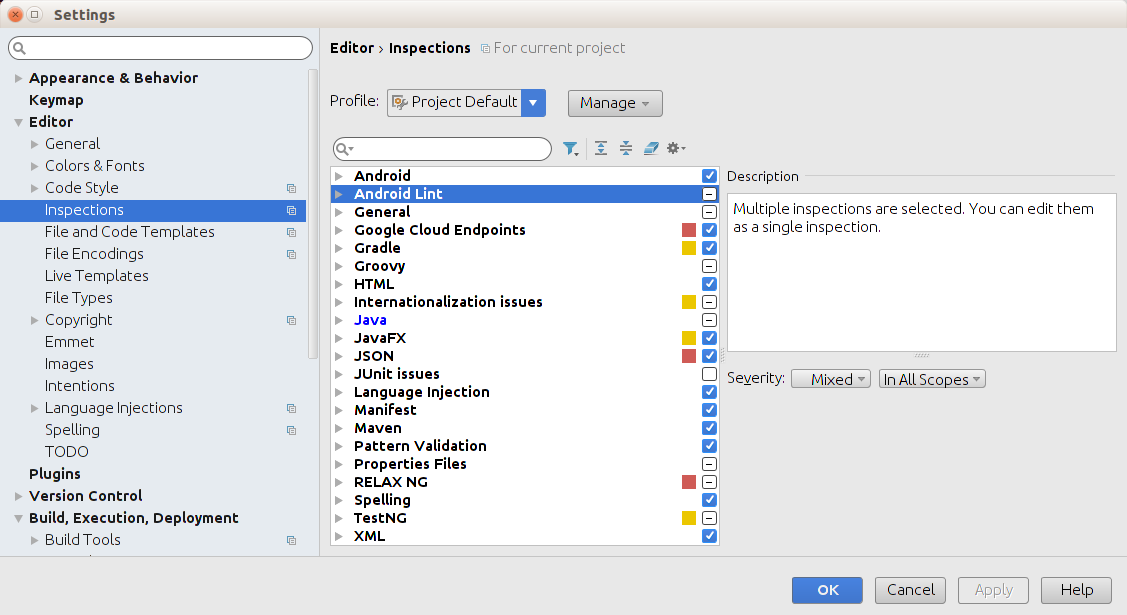
Figure 5. Configure inspections.
Note: To change the behavior of specific inspection notifications, change the inspection severity, for example from warning to error.
To manually run inspections in Android Studio, choose Analyze > Inspect Code. The Inspections Scope dialog appears so you can specify the desired inspection profile and scope.
Running inspections from the command line
You can also run lint inspections from the command line in your SDK directory.
sdk$ lint [flags]
Note: The lint --show and --list
flags can be used to display the available issues and explanations.
For more information, see
Improving Your Code with lint
and lint tool.
Annotations in Android Studio
Android Studio supports annotations for variables, parameters, and return values to help you
catch bugs, such as null pointer exceptions and resource type conflicts. The
Android SDK Manager packages
the Support-Annotations library
in the Android Support Repository for use with Android
Studio. Android Studio validates the configured annotations during code inspection.
To add annotations to your code in Android Studio, first add a dependency for the
Support-Annotations library:
- Select File > Project Structure.
- In the Project Structure dialog, select the desired module, click the Dependencies tab.
- Click the
 icon to include a
Library dependency.
icon to include a
Library dependency. - In the Choose Library Dependency dialog, select
support-annotationsand click Ok.
The build.gradle file is updated with the support-annotations
dependency.
You can also manually add this dependency to your build.gradle file, as shown in
the following example.
dependencies {
    compile fileTree(dir: 'libs', include: ['*.jar'])
    compile 'com.android.support:appcompat-v7:22.0.0'
    compile 'com.android.support:support-annotations:22.0.0'
}
Inferring nullability
A nullability analysis scans the contracts throughout the method hierarchies in your code to detect:
- Calling methods that can return null
- Methods that should not return null
- Variables, such as fields, local variables, and parameters, that can be null
- Variables, such as fields, local variables, and parameters, that cannot hold a null value
The analysis then automatically inserts the appropriate null annotations in the detected locations.
To run a nullability analysis in Android Studio,
select the Analyze > Infer Nullity
menu option. Android Studio inserts the Android
@Nullable and
@NonNull annotations in detected locations
in your code. After running a null analysis, it's good practice to verify the injected
annotations.
Note: The nullability analysis may insert the IntelliJ
@Nullable and
@NotNull annotations instead of the Android null annotations. When running
a null analysis, manually search and replace any IntelliJ annotations or include
com.intellij:annotations:12.0 as a compile dependency in your
build.gradle file. This example includes the IntelliJ annotations 12.0 library as a
dependency in the build.gradle file:
dependencies {
    compile fileTree(dir: 'libs', include: ['*.jar'])
    compile 'com.android.support:appcompat-v7:22.0.0'
    compile 'com.android.support:support-annotations:22.0.0'
    compile 'com.intellij:annotations:12.0'
}
Validating annotations
You can also manually add nullability, resource, and enumerated annotations throughout your code
to perform validations for a variety of reference values, such as
R.string resources,
Drawable
resources,
Color resources,
and enumerated constants.
Run Analyze > Inspect Code to validate the configured annotations.
For a complete list of the supported annotations, either use the auto-complete feature to display
the available options for the import android.support.annotation. statement or
view the contents of the
Support-Annotations
library.
For more details about Android annotations, see Improving Code Inspection with Annotations.
Dynamic layout preview
Android Studio allows you to work with layouts in both a Design View
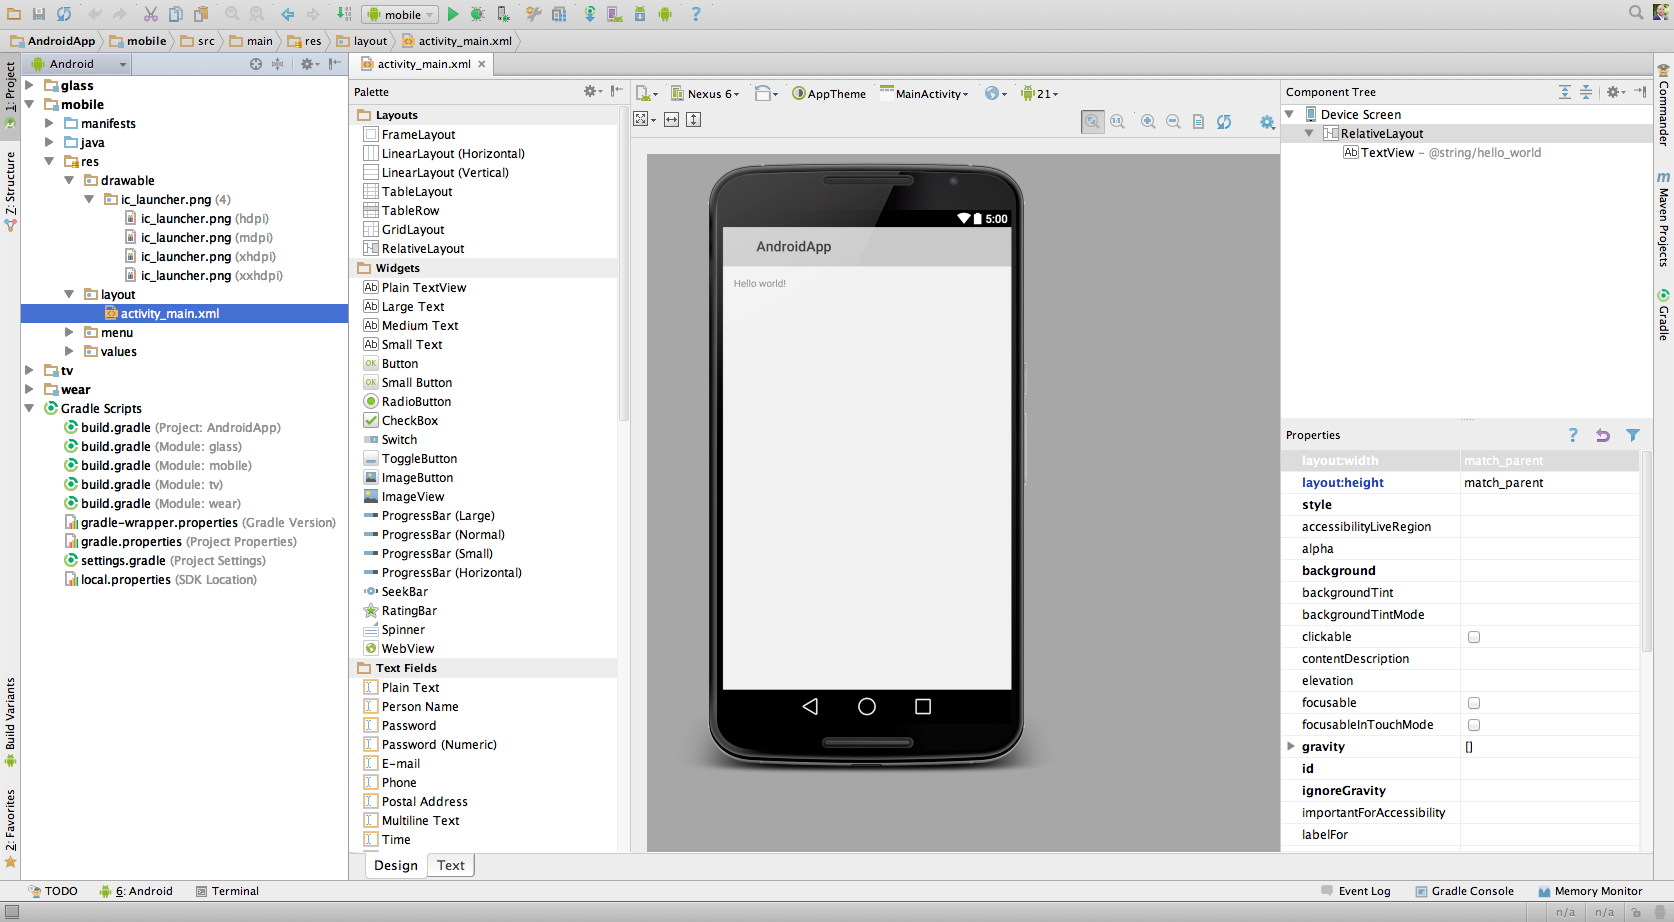
Figure 6. Hello World App with Design View.
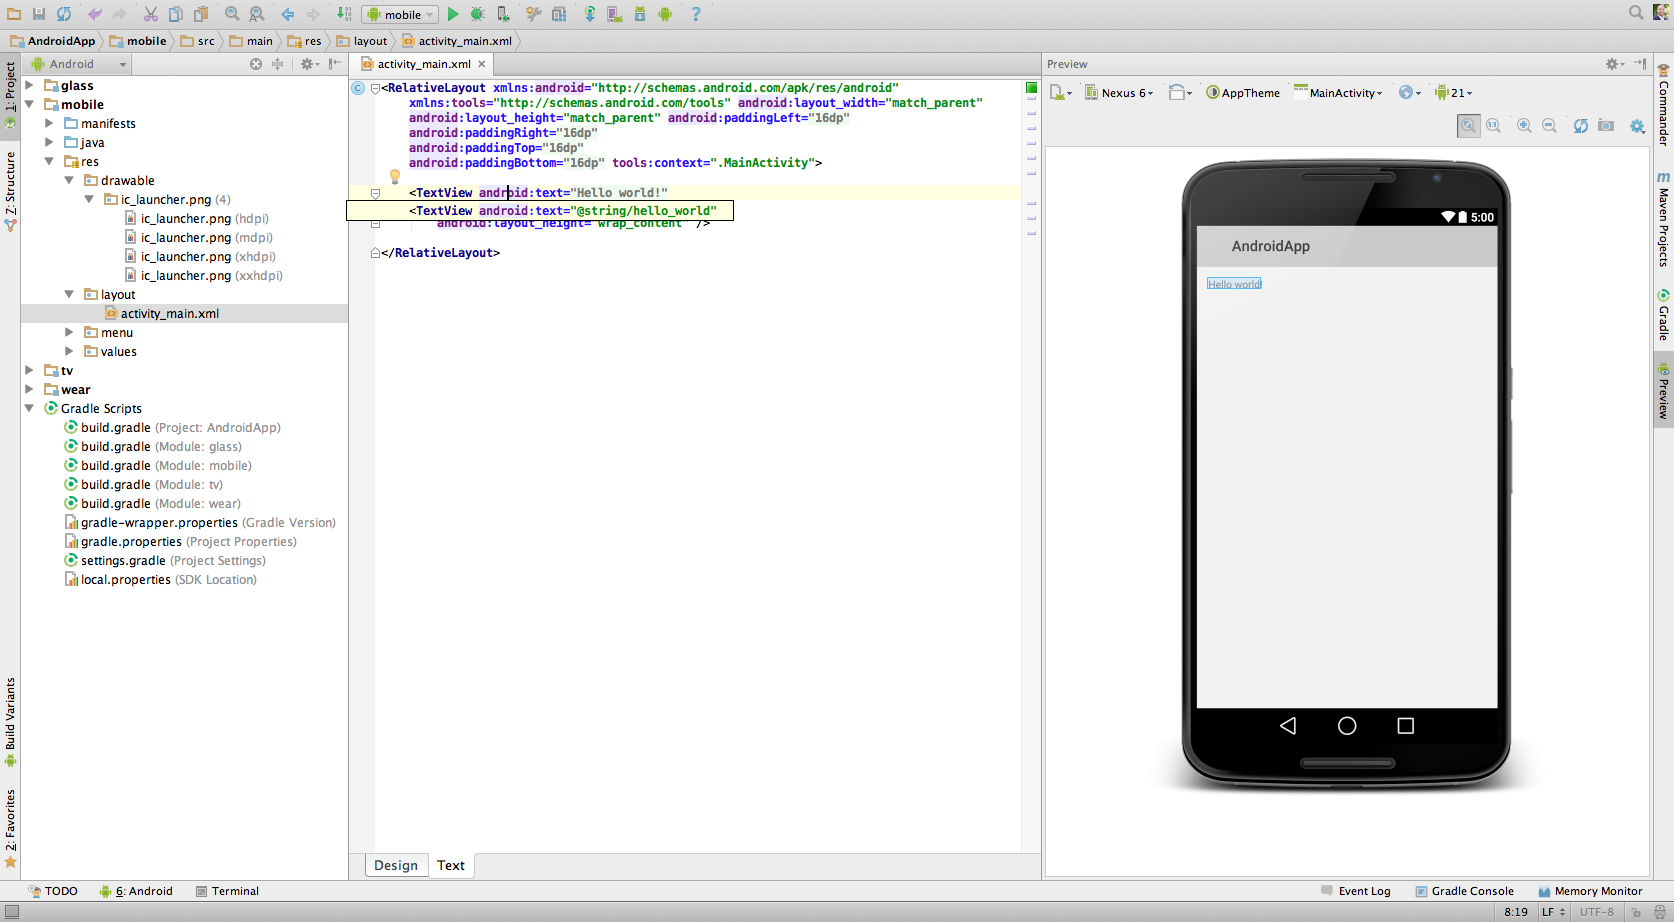
and a Text View.
Easily select and preview layout changes for different device images, display densities, UI modes, locales, and Android versions (multi-API version rendering).
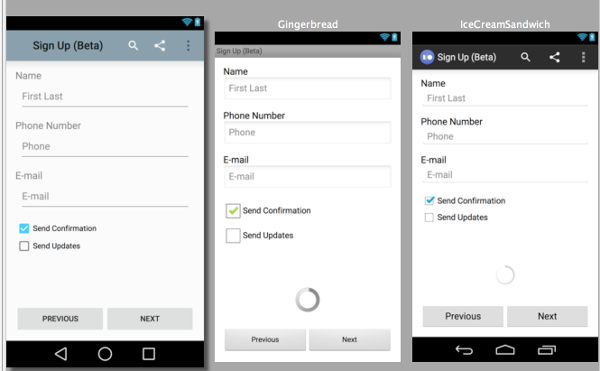
Figure 8. Multi-API version rendering.
From the Design View, you can drag and drop elements from the Palette to the Preview or Component Tree. The Text View allows you to directly edit the XML settings, while previewing the device display.
Log messages
When you build and run your app with Android Studio, you can view adb and device log messages (logcat) by clicking Android at the bottom of the window.
If you want to debug your app with the
Android Debug Monitor, you can launch it by
clicking Monitor
 in the toolbar. The Debug Monitor is where you can find the complete set of
DDMS tools for profiling your app,
controlling device behaviors, and more. It also includes the Hierarchy Viewer tools to help
optimize your layouts.
in the toolbar. The Debug Monitor is where you can find the complete set of
DDMS tools for profiling your app,
controlling device behaviors, and more. It also includes the Hierarchy Viewer tools to help
optimize your layouts.