In this document
You should also read
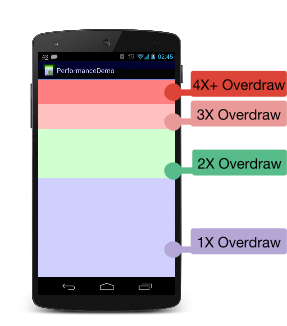
This walkthrough shows how to visualize overdraw on your mobile device by color-coding interface elements based on how often they are drawn underneath.
What it's good for:
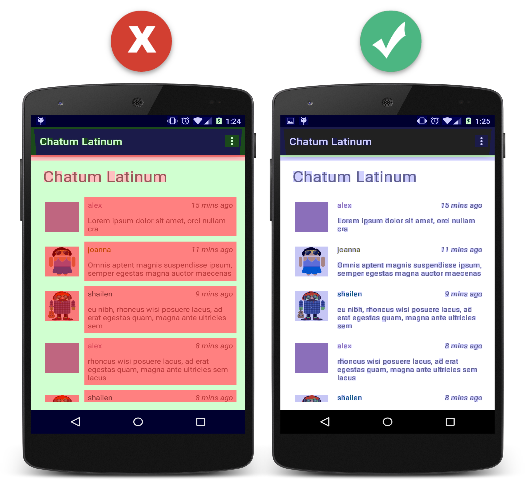
- Showing where an app might be doing more rendering work than necessary.
- Helping you see where you might be able to reduce rendering overhead.
Prerequisites
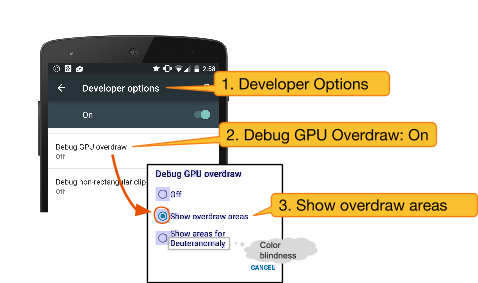
- A mobile device with Developer Options enabled.