In this document
You should also read
Heap Viewer, Memory Monitor, and Allocation Tracker are complementary tools that visualize the memory your app uses.
- Use the Memory Monitor Tool to find out whether undesirable garbage collection (GC) event patterns might be causing your performance problems.
- Run Heap Viewer to identify object types that get or stay allocated unexpectedely or unecessarily.
- Use Allocation Tracker to identify where in your code the problem might be.
Memory Monitor
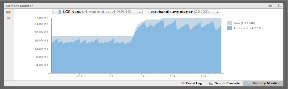
Figure 1. Memory Monitor.
- Shows available and used memory as they both change over time for your app in a graph, with dips indicating Garbage Collection (GC) events.
- Provides a quick way to test whether app slowness might be related to excessive GC events.
- Provides a quick way to see whether app crashes might be related to running out of memory.
- Runs live on your application and updates about once a second.
- Helps quickly identify the potential of memory leaks.
- Helps identify GC patterns for your application and determine whether they are healthy and what you expect.
- Is easy to use, and it is easy to interpret what you see.
- However, Memory Monitor does not tell you which objects are the cause of your problems, or where in your code it might be.
Heap Viewer
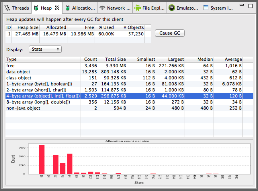
Figure 2. Heap Viewer.
- Shows snapshots of a number of objects allocated by type.
- Samples data every time a garbage collection event occurs naturally or triggered by you.
- Helps identify which object types might be involved in memory leaks.
- However, you have to look for changes over time yourself by tracking what's happening in the graph.
Allocation Tracker
Figure 3. Allocation Tracker.
- Shows when and where your code allocates object types, their size, allocating thread, and stack traces.
- Helps recognize memory churn through recurring allocation/deallocation patterns.
- Can be used in combination with Heap Viewer to track down memory leaks. For example, if you see a bitmap object resident on the heap, you can find its allocation location with Allocation Tracker.
- However, it takes time and experience to learn to interpret the output from this tool.