Show navigation Hide navigation

Memory Monitor Walkthrough

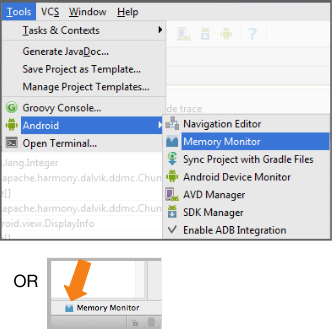
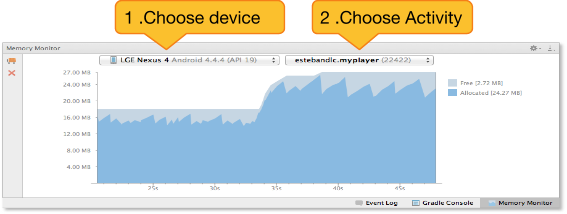
This walkthrough shows the basic usage and workflow for the Memory Monitor tool in Android Studio. Memory Monitor reports in real-time how your app allocates memory.

What it's good for:

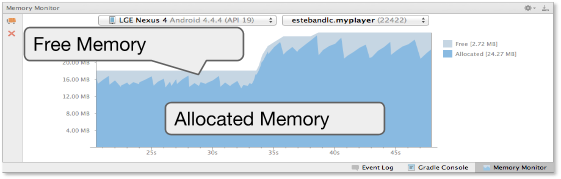
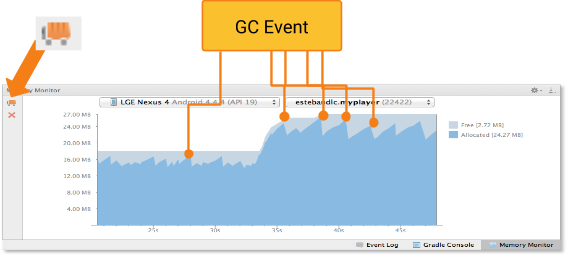
  • Showing available and used memory in a graph, and garbage collection events over time.
  • Quickly testing whether app slowness might be related to excessive garbage collection events.
  • Quickly testing whether app crashes may be related to running out of memory.

Prerequisites

Working with Memory Monitor

    1. Figure 1. Starting Memory Monitor.

    2. Connect your mobile device to your computer.
    3. Open your application in Android Studio, build the source, and run it on your device.
    4. In Android Studio, choose Tools > Android > Memory Monitor.

    1. Figure 2. Choosing the device and Activity to monitor.

    2. This opens the Memory Monitor pane.
    3. Choose your device from the drop-down menu at the top left of the pane.
    4. Choose your Activity from the drop-down menu at the top right of the pane.

    1. Figure 3. Allocated and free memory in Memory Monitor.

    2. Once Memory Monitor starts tracking your device, a stacked graph appears, tracking memory usage over time.

      Dark blue: Amount of memory that your app is currently using.

      Light blue: Available, unallocated memory.

    3. Over time, this graph updates, showing changes in memory usage.
    4. As your app allocates and frees memory, the allocated amount shown in the graph changes.
    5. When you see the allocated memory drop by a large amount, a garbage collection (GC) event has occurred.

    1. Figure 4. Forcing a GC (Garbage Collection) event.

    2. You can force a garbage collection event by clicking on the garbage truck icon .